3VD0 | pdb_00003vd0

structure of p73 DNA binding domain tetramer modulates p73 transactivation


Experimental Data Snapshot

  • Method: X-RAY DIFFRACTION
  • Resolution: 2.95 Å
  • R-Value Free: 
    0.254 (Depositor), 0.250 (DCC) 
  • R-Value Work: 
    0.235 (Depositor), 0.230 (DCC) 
  • R-Value Observed: 
    0.235 (Depositor) 

Starting Model: experimental
View more details

wwPDB Validation   3D Report Full Report


This is version 1.3 of the entry. See complete history


Literature

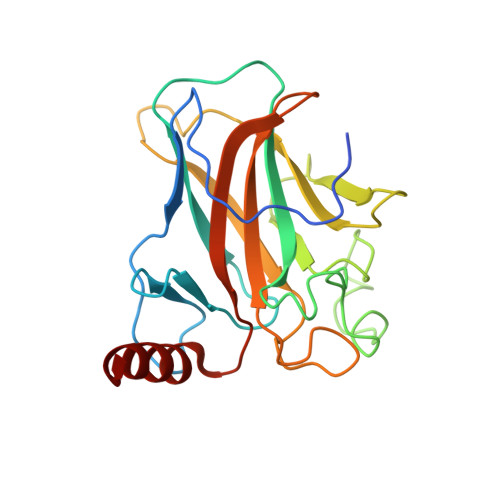
Structure of p73 DNA-binding domain tetramer modulates p73 transactivation.

Ethayathulla, A.S.Tse, P.W.Monti, P.Nguyen, S.Inga, A.Fronza, G.Viadiu, H.

(2012) Proc Natl Acad Sci U S A 109: 6066-6071

  • DOI: https://doi.org/10.1073/pnas.1115463109
  • Primary Citation of Related Structures:  
    3VD0, 3VD1, 3VD2

  • PubMed Abstract: 

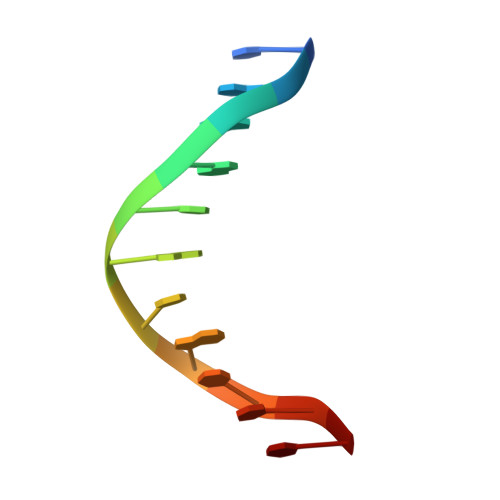
    The transcription factor p73 triggers developmental pathways and overlaps stress-induced p53 transcriptional pathways. How p53-family response elements determine and regulate transcriptional specificity remains an unsolved problem. In this work, we have determined the first crystal structures of p73 DNA-binding domain tetramer bound to response elements with spacers of different length. The structure and function of the adaptable tetramer are determined by the distance between two half-sites. The structures with zero and one base-pair spacers show compact p73 DNA-binding domain tetramers with large tetramerization interfaces; a two base-pair spacer results in DNA unwinding and a smaller tetramerization interface, whereas a four base-pair spacer hinders tetramerization. Functionally, p73 is more sensitive to spacer length than p53, with one base-pair spacer reducing 90% of transactivation activity and longer spacers reducing transactivation to basal levels. Our results establish the quaternary structure of the p73 DNA-binding domain required as a scaffold to promote transactivation.


  • Organizational Affiliation
    • Laboratory of Structural Biochemistry, Department of Chemistry and Biochemistry, University of California at San Diego, 9500 Gilman Drive 0378, La Jolla, CA 92093, USA.

Macromolecules

Find similar proteins by:  (by identity cutoff)  |  3D Structure
Entity ID: 1
MoleculeChains Sequence LengthOrganismDetailsImage
Tumor protein p73210Homo sapiensMutation(s): 0 
UniProt & NIH Common Fund Data Resources
Find proteins for O15350 (Homo sapiens)
Explore O15350 
Go to UniProtKB:  O15350
PHAROS:  O15350
GTEx:  ENSG00000078900 
Entity Groups  
Sequence Clusters30% Identity50% Identity70% Identity90% Identity95% Identity100% Identity
UniProt GroupO15350
Sequence Annotations
Expand
  • Reference Sequence

Find similar nucleic acids by:  Sequence   |   3D Structure  

Entity ID: 2
MoleculeChains LengthOrganismImage
DNA (5'-D(*CP*AP*GP*GP*CP*AP*TP*GP*CP*CP*TP*G)-3')12N/A
Sequence Annotations
Expand
  • Reference Sequence
Experimental Data & Validation

Experimental Data

  • Method: X-RAY DIFFRACTION
  • Resolution: 2.95 Å
  • R-Value Free:  0.254 (Depositor), 0.250 (DCC) 
  • R-Value Work:  0.235 (Depositor), 0.230 (DCC) 
  • R-Value Observed: 0.235 (Depositor) 
Space Group: P 1 21 1
Unit Cell:
Length ( Å )Angle ( ˚ )
a = 82.09α = 90
b = 104.521β = 96.18
c = 122.994γ = 90
Software Package:
Software NamePurpose
HKL-2000data collection
PHASERphasing
CNSrefinement
HKL-2000data reduction
SCALEPACKdata scaling

Structure Validation

View Full Validation Report


Entry History 

Deposition Data

Revision History  (Full details and data files)

  • Version 1.0: 2012-04-18
    Type: Initial release
  • Version 1.1: 2012-07-25
    Changes: Database references
  • Version 1.2: 2014-10-08
    Changes: Structure summary
  • Version 1.3: 2023-09-13
    Changes: Data collection, Database references, Derived calculations, Refinement description