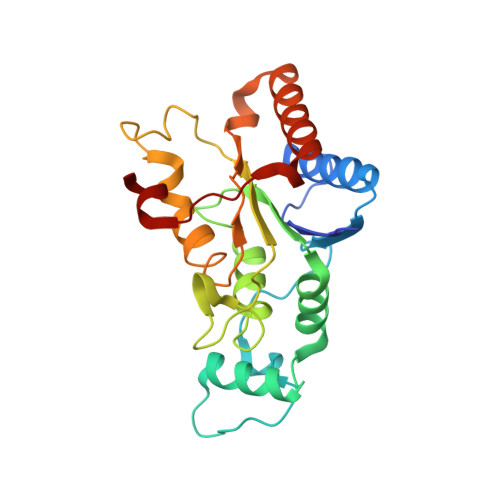
The structure of the leukemia drug imatinib bound to human quinone reductase 2 (NQO2).
Winger, J.A., Hantschel, O., Superti-Furga, G., Kuriyan, J.(2009) BMC Struct Biol 9: 7-7
- PubMed: 19236722
- DOI: https://doi.org/10.1186/1472-6807-9-7
- Primary Citation of Related Structures:
3FW1 - PubMed Abstract:
Imatinib represents the first in a class of drugs targeted against chronic myelogenous leukemia to enter the clinic, showing excellent efficacy and specificity for Abl, Kit, and PDGFR kinases. Recent screens carried out to find off-target proteins that bind to imatinib identified the oxidoreductase NQO2, a flavoprotein that is phosphorylated in a chronic myelogenous leukemia cell line. We examined the inhibition of NQO2 activity by the Abl kinase inhibitors imatinib, nilotinib, and dasatinib, and obtained IC50 values of 80 nM, 380 nM, and >100 microM, respectively. Using electronic absorption spectroscopy, we show that imatinib binding results in a perturbation of the protein environment around the flavin prosthetic group in NQO2. We have determined the crystal structure of the complex of imatinib with human NQO2 at 1.75 A resolution, which reveals that imatinib binds in the enzyme active site, adjacent to the flavin isoalloxazine ring. We find that phosphorylation of NQO2 has little effect on enzyme activity and is therefore likely to regulate other aspects of NQO2 function. The structure of the imatinib-NQO2 complex demonstrates that imatinib inhibits NQO2 activity by competing with substrate for the active site. The overall conformation of imatinib when bound to NQO2 resembles the folded conformation observed in some kinase complexes. Interactions made by imatinib with residues at the rim of the active site provide an explanation for the binding selectivity of NQO2 for imatinib, nilotinib, and dasatinib. These interactions also provide a rationale for the lack of inhibition of the related oxidoreductase NQO1 by these compounds. Taken together, these studies provide insight into the mechanism of NQO2 inhibition by imatinib, with potential implications for drug design and treatment of chronic myelogenous leukemia in patients.
Organizational Affiliation:
Department of Molecular and Cell Biology, California Institute for Quantitative Biosciences, Howard Hughes Medical Institute, University of California, Berkeley, USA. wingerj@berkeley.edu