9ED7 | pdb_00009ed7

Active state of mTOR on membrane


Experimental Data Snapshot

  • Method: ELECTRON MICROSCOPY
  • Resolution: 3.16 Å
  • Aggregation State: PARTICLE 
  • Reconstruction Method: SINGLE PARTICLE 

wwPDB Validation   3D Report Full Report


This is version 1.1 of the entry. See complete history


Literature

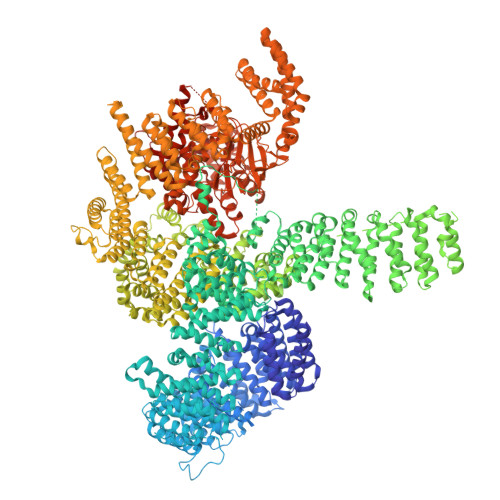
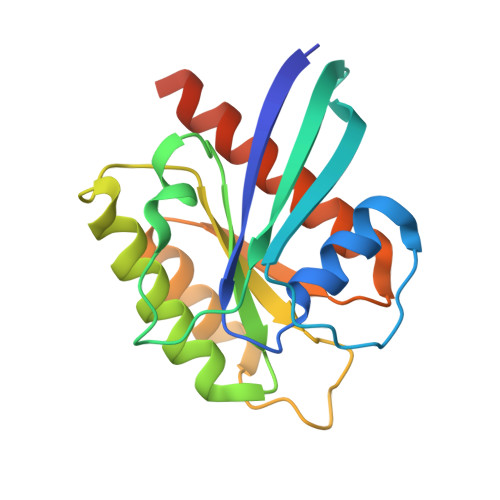
Structural basis for mTORC1 activation on the lysosomal membrane.

Cui, Z.Esposito, A.Napolitano, G.Ballabio, A.Hurley, J.H.

(2025) Nature 

  • DOI: https://doi.org/10.1038/s41586-025-09545-3
  • Primary Citation of Related Structures:  
    9ED4, 9ED6, 9ED7, 9ED8

  • PubMed Abstract: 

    The mechanistic target of rapamycin complex 1 (mTORC1) integrates growth factor (GF) and nutrient signals to stimulate anabolic processes connected to cell growth and inhibit catabolic processes such as autophagy 1,2 . GF signalling through the tuberous sclerosis complex regulates the lysosomally localized small GTPase RAS homologue enriched in brain (RHEB) 3 . Direct binding of RHEB-GTP to the mTOR kinase subunit of mTORC1 allosterically activates the kinase by inducing a large-scale conformational change 4 . Here we reconstituted mTORC1 activation on membranes by RHEB, RAGs and Ragulator. Cryo-electron microscopy showed that RAPTOR and mTOR interact directly with the membrane. Full engagement of the membrane anchors is required for optimal alignment of the catalytic residues in the mTOR kinase active site. Converging signals from GFs and nutrients drive mTORC1 recruitment to and activation on lysosomal membrane in a four-step process, consisting of (1) RAG-Ragulator-driven recruitment to within ~100 Å of the lysosomal membrane; (2) RHEB-driven recruitment to within ~40 Å; (3) RAPTOR-membrane engagement and intermediate enzyme activation; and (4) mTOR-membrane engagement and full enzyme activation. RHEB and membrane engagement combined leads to full catalytic activation and structurally explains GF and nutrient signal integration at the lysosome.


  • Organizational Affiliation
    • Department of Molecular and Cell Biology, University of California, Berkeley, Berkeley, CA, USA.

Macromolecules
Find similar proteins by:  (by identity cutoff)  |  3D Structure
Entity ID: 1
MoleculeChains Sequence LengthOrganismDetailsImage
Serine/threonine-protein kinase mTOR2,549Homo sapiensMutation(s): 0 
Gene Names: MTORFRAPFRAP1FRAP2RAFT1RAPT1
EC: 2.7.11.1 (PDB Primary Data), 2.7.10.2 (UniProt)
UniProt & NIH Common Fund Data Resources
Find proteins for P42345 (Homo sapiens)
Explore P42345 
Go to UniProtKB:  P42345
PHAROS:  P42345
GTEx:  ENSG00000198793 
Entity Groups  
Sequence Clusters30% Identity50% Identity70% Identity90% Identity95% Identity100% Identity
UniProt GroupP42345
Sequence Annotations
Expand
  • Reference Sequence
Find similar proteins by:  (by identity cutoff)  |  3D Structure
Entity ID: 2
MoleculeChains Sequence LengthOrganismDetailsImage
Target of rapamycin complex subunit LST8326Homo sapiensMutation(s): 0 
Gene Names: MLST8GBLLST8
UniProt & NIH Common Fund Data Resources
Find proteins for Q9BVC4 (Homo sapiens)
Explore Q9BVC4 
Go to UniProtKB:  Q9BVC4
PHAROS:  Q9BVC4
GTEx:  ENSG00000167965 
Entity Groups  
Sequence Clusters30% Identity50% Identity70% Identity90% Identity95% Identity100% Identity
UniProt GroupQ9BVC4
Sequence Annotations
Expand
  • Reference Sequence
Find similar proteins by:  (by identity cutoff)  |  3D Structure
Entity ID: 3
MoleculeChains Sequence LengthOrganismDetailsImage
GTP-binding protein RhebC [auth L]184Homo sapiensMutation(s): 0 
Gene Names: RHEBRHEB2
EC: 3.6.5
UniProt & NIH Common Fund Data Resources
Find proteins for Q15382 (Homo sapiens)
Explore Q15382 
Go to UniProtKB:  Q15382
PHAROS:  Q15382
GTEx:  ENSG00000106615 
Entity Groups  
Sequence Clusters30% Identity50% Identity70% Identity90% Identity95% Identity100% Identity
UniProt GroupQ15382
Sequence Annotations
Expand
  • Reference Sequence
Small Molecules
Ligands 4 Unique
IDChains Name / Formula / InChI Key2D Diagram3D Interactions
IHP
Query on IHP

Download Ideal Coordinates CCD File 
G [auth A]INOSITOL HEXAKISPHOSPHATE
C6 H18 O24 P6
IMQLKJBTEOYOSI-GPIVLXJGSA-N
GSP
Query on GSP

Download Ideal Coordinates CCD File 
H [auth L]5'-GUANOSINE-DIPHOSPHATE-MONOTHIOPHOSPHATE
C10 H16 N5 O13 P3 S
XOFLBQFBSOEHOG-UUOKFMHZSA-N
ANP
Query on ANP

Download Ideal Coordinates CCD File 
D [auth A]PHOSPHOAMINOPHOSPHONIC ACID-ADENYLATE ESTER
C10 H17 N6 O12 P3
PVKSNHVPLWYQGJ-KQYNXXCUSA-N
MG
Query on MG

Download Ideal Coordinates CCD File 
E [auth A],
F [auth A],
I [auth L]
MAGNESIUM ION
Mg
JLVVSXFLKOJNIY-UHFFFAOYSA-N
Experimental Data & Validation

Experimental Data

  • Method: ELECTRON MICROSCOPY
  • Resolution: 3.16 Å
  • Aggregation State: PARTICLE 
  • Reconstruction Method: SINGLE PARTICLE 
EM Software:
TaskSoftware PackageVersion
MODEL REFINEMENTPHENIX
MODEL REFINEMENTCoot
MODEL REFINEMENTISOLDE
RECONSTRUCTIONcryoSPARC4.4

Structure Validation

View Full Validation Report


Entry History & Funding Information

Deposition Data


Funding OrganizationLocationGrant Number
National Institutes of Health/National Cancer Institute (NIH/NCI)United StatesCA285366

Revision History  (Full details and data files)

  • Version 1.0: 2025-09-10
    Type: Initial release
  • Version 1.1: 2025-10-01
    Changes: Data collection, Database references