


RCSB PDB Help
Exploring a 3D Structure
Structure Summary Page
Introduction
What is the Structure Summary page?
For any experimental structure (PDB entry), the Structure Summary page provides an overview of the structure. It presents information about the structure, what the structure looks like, which macromolecules and small molecule ligands it contains, which experimental method(s) were used to determine the structure, who solved the structure, what the quality of the structure is, which publications describe this structure, etc. All information pertaining to the PDB structure and links to relevant information about it in other bioinformatics data resources can be found here.
For any Computed Structure Model (CSM entry available from RCSB.org), the Structure Summary page provides an overview of the structure, its composition, and information about model confidence.
Why use the Structure Summary Page?
This page provides a quick and convenient summary of key information about the specific structure. In addition, it presents a variety of information related to the entry integrated from other bioinformatics resources (along with links to these resources where appropriate). It also offers options to search for entries with similar or related components and/or other specific information pertaining to the structure.
Documentation
Each Structure Summary page has specific sections that present different types of information about the structure for both experimental structures and CSMs (Figure 1).
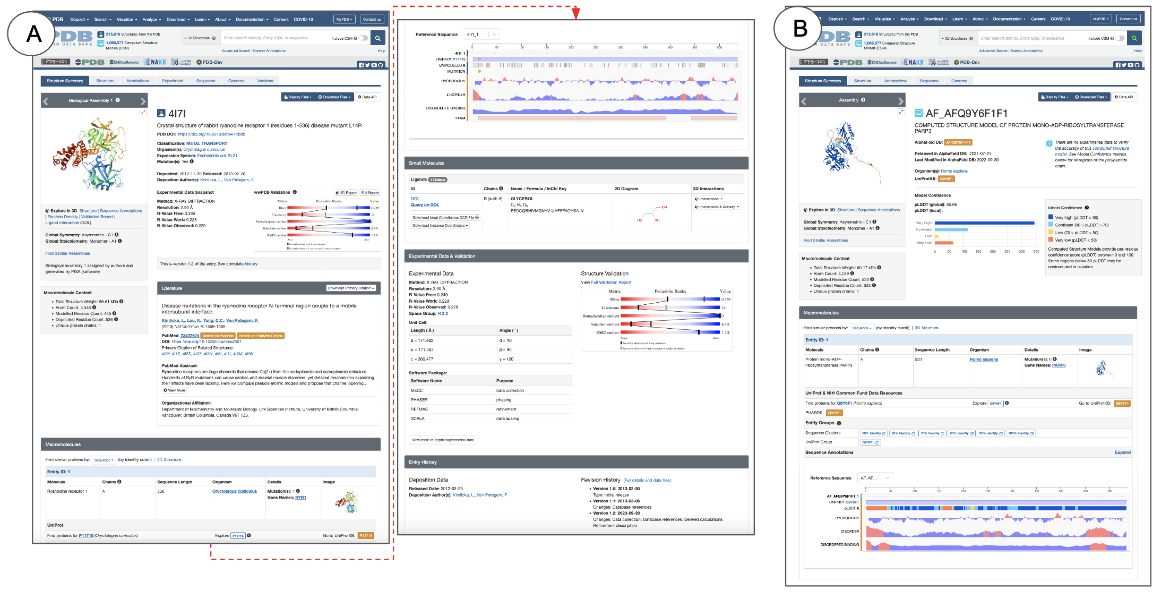
|
| Figure 1: Structure Summary page showing its various sections for: A. Experimental structures (PDB ID 4l7l) and B. Computed Structure Model (CSM ID AF_AFQ9Y6F1F1 or AlphaFoldDB ID AF-Q9Y6F1-F1). |
Key sections of Structure Summary pages for experimental structures and CSMs (Figure 2) are described below, highlighting different types of information about the structure, and options to find other examples of 3D structures with specific structural features, properties, and annotations.
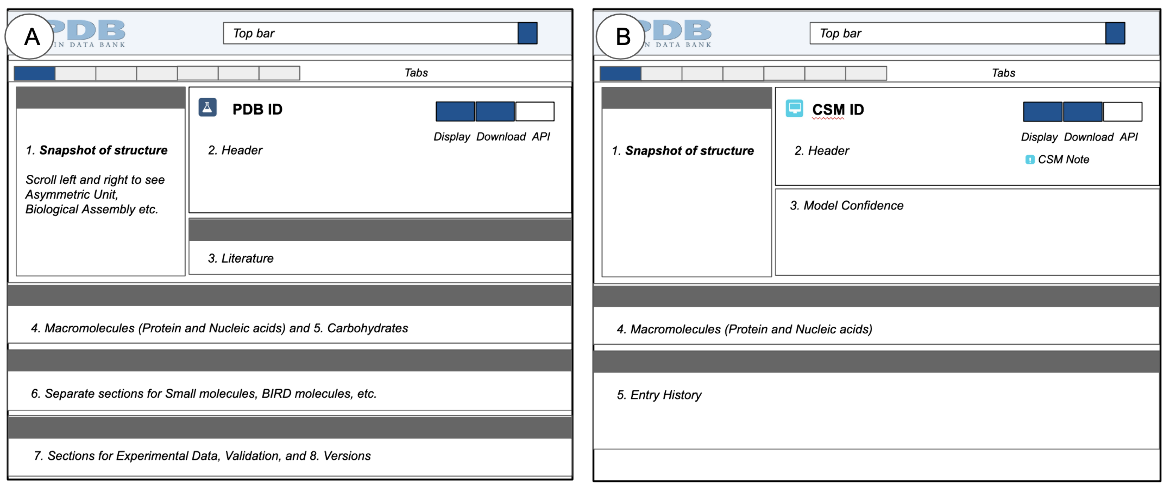
|
| Figure 2: A schematic representation of a Structure Summary pages, A. showing the various sections found in all experimental structures (PDB entries), and B. showing sections found in all CSMs. |
Each section of the Structure Summary page is described here to explain
- What does the interface look like for this section?
- What can you learn about the structure from this section?
- How can you find other 3D structures that have the same or similar properties as that presented in this section?
Conventions used in the Structure Summary and related pages
- Any orange-colored button or box when clicked will take you to another bioinformatics data resource with more information pertaining to the structure.
- Orange banners on the top or side of any section of a page indicate that the information presented there was derived from an external source.
- Blue banners indicate that the data come directly from the PDB or were organized/analyzed by the RCSB PDB and presented there.
- Experimental structures are identified with a dark blue flask icon, while CSMs are identified with a cyan colored computer icon. Learn more about these icons.
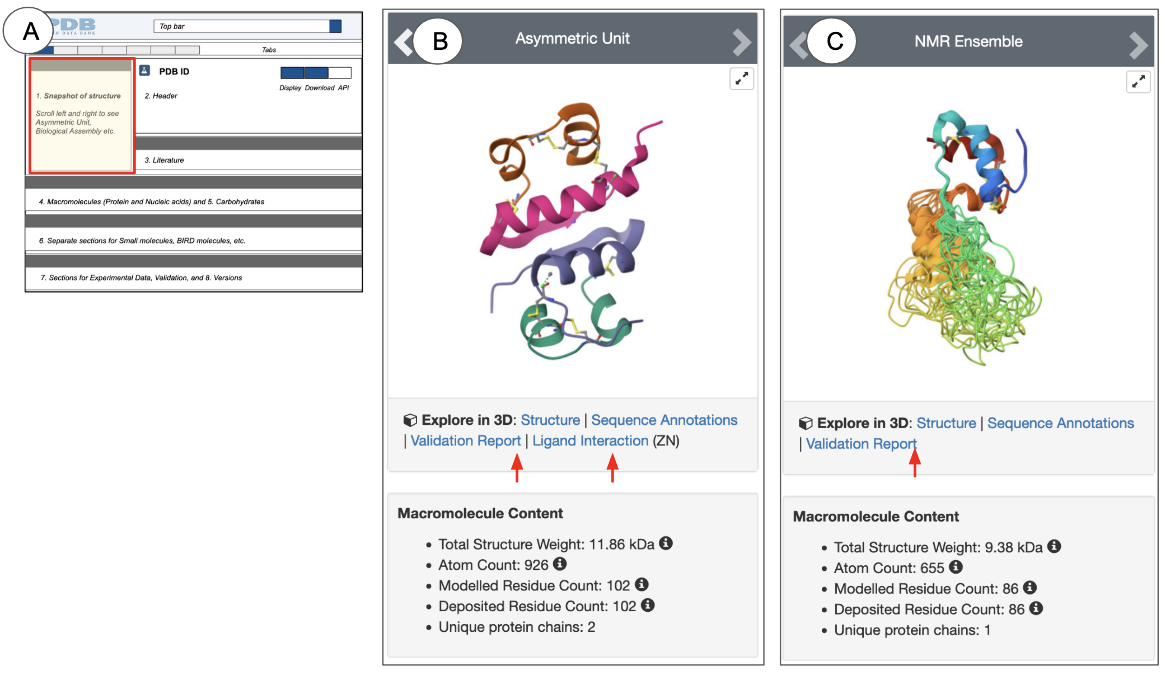
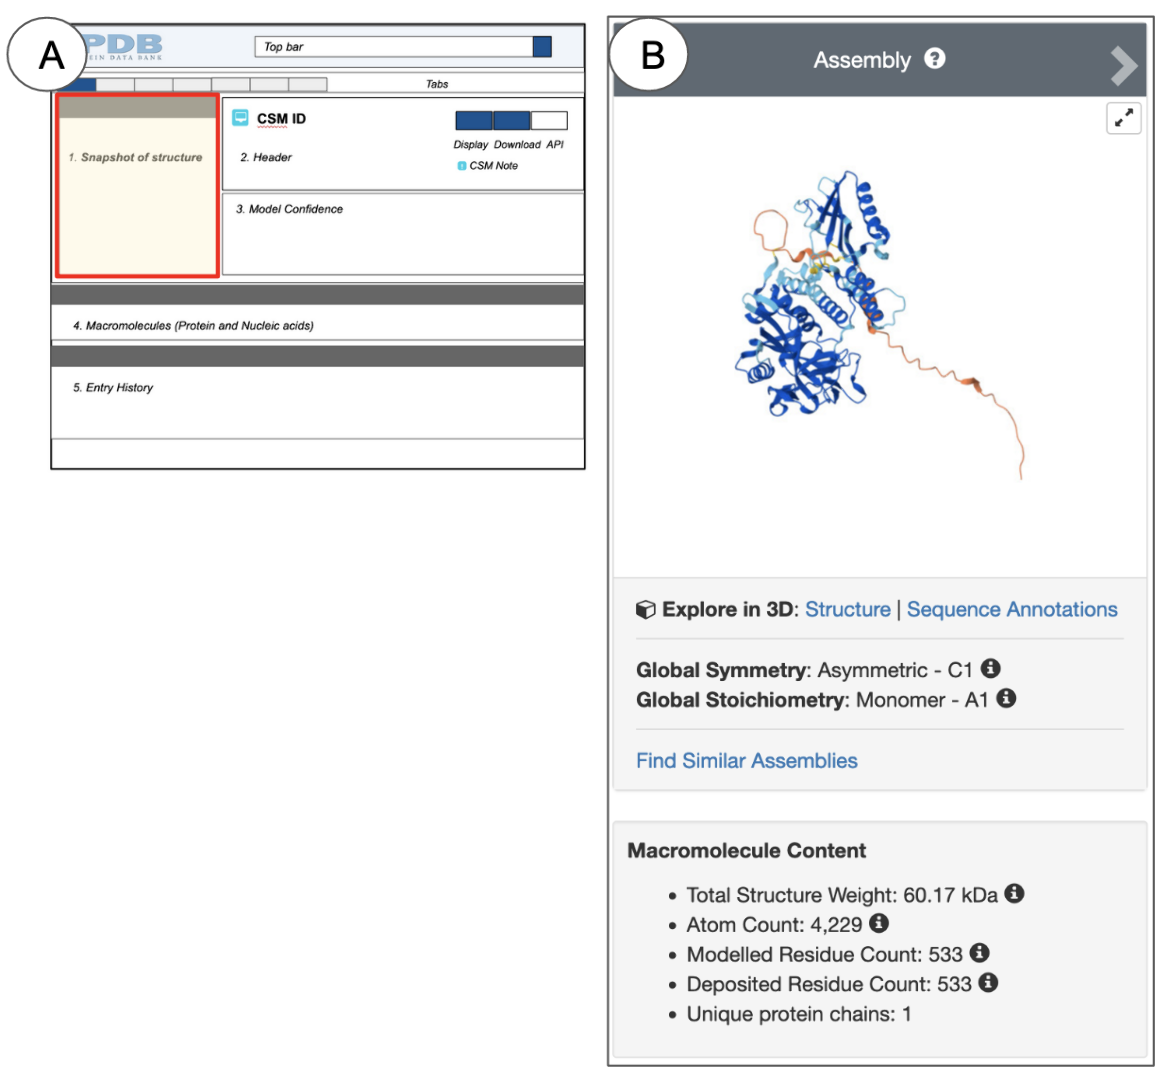
Snapshot of the Structure
The Interface
On the top left, the Structure Summary page snapshot box provides a quick glimpse of what the contents of the entry look like (Figure 3, 4).
Depending on the method used to determine the structure, the heading for this section (gray bar) says “Biological Assembly” (for X-ray, 3DEM, and CSM structures) or “NMR Ensemble” (for NMR structures). This gray heading bar has arrows pointing to the left and right. You can click on these to view the structure of the asymmetric unit or NMR Ensemble and the biological assemblies. Experimental structures determined by X-ray crystallography and 3DEM may have assemblies that are related by specific symmetry relationships. Since a structure may have multiple biological assemblies, view them all before selecting one for visualization and analysis. Learn more about Biological Assemblies.
NMR structures and CSMs do not use symmetry relationships to build assemblies. Yet, all 3D structures (experimental and CSMs) have assembly coordinates so that they can be included in structure-based query and analysis. In the case of NMR structures and CSMs, the representative/predicted model and assembly coordinates are identical.
|
| Figure 3: Snapshot of experimental structures. (A) shows the schematic of the Structure Summary page and highlights the location of the Snapshot in a red-outlined box. (B) and (C) are examples of structure snapshots from PDB ID 1trz (X-ray structure) and PDB ID 2kqp (NMR structure), respectively. |
When a single protein is present in an experimental structure, it is colored so that the N-terminus is colored blue, the C-terminus is colored red, and all the residues in between follow the rainbow color scheme (see Figure 3C). However, CSMs with a single protein chain are colored by a model confidence score where regions of high confidence are colored in dark blue and regions of lower confidence are colored yellow or orange (see Figure 4B). Structures with multiple chains are colored so that each polymer chain has a different color.
|
| Figure 4: Snapshot of CSMs. (A) shows the schematic of the Structure Summary page and highlights the location of the Snapshot in a red-outlined box. (B) is an example of a structure snapshots from CSM ID AF_AFQ9Y6F1F1 or AlphaFoldDB ID AF-Q9Y6F1-F1. |
Learning about the Structure
Things you can learn about a structure from this section include:
- Biological Assembly: By default the first biological assembly is displayed for X-ray and 3DEM structures, while the structural ensemble is shown for NMR structures.
- Contents: In these snapshot images each polymer (protein or nucleic acid) chain instance is assigned a unique color and presented either in the ribbons or cartoons representation (for smaller structures) or as a surface (for larger structures). Ligands are shown in ball-and-stick representations.
- Interactive view in Mol*: Click on the hyperlinked words below the snapshots to view the structure interactively in Mol*.
- “Structure” visualizes the structure or assembly in Mol*. See an example here. The Mol* view can also be accessed by clicking on the 3D view tab.
- “Ligand Interaction” opens the structure or assembly in Mol*, where the displayed structure is zoomed in and focused on the ligand of interest. See an example here.
- “Predict Membrane” draws the predicted membrane location for membrane protein structures. See an example here.
- “Electron Density” displays the electron density for X-ray structures in Mol*, allowing you to visualize a structure within its electron density map. See an example here.
- Information about the structure’s contents (e.g., number of atoms, residues, chains etc.) is presented below the structure snapshot (See Figure 3).
- Symmetry: Underneath each biological assembly snapshot, the local, global, and pseudo symmetries of the structure are shown (Figure 5). Clicking on the 3D View hyperlink next to each symmetry shown allows you to view the associated symmetry axes in Mol*. Learn more about symmetries in PDB structures.
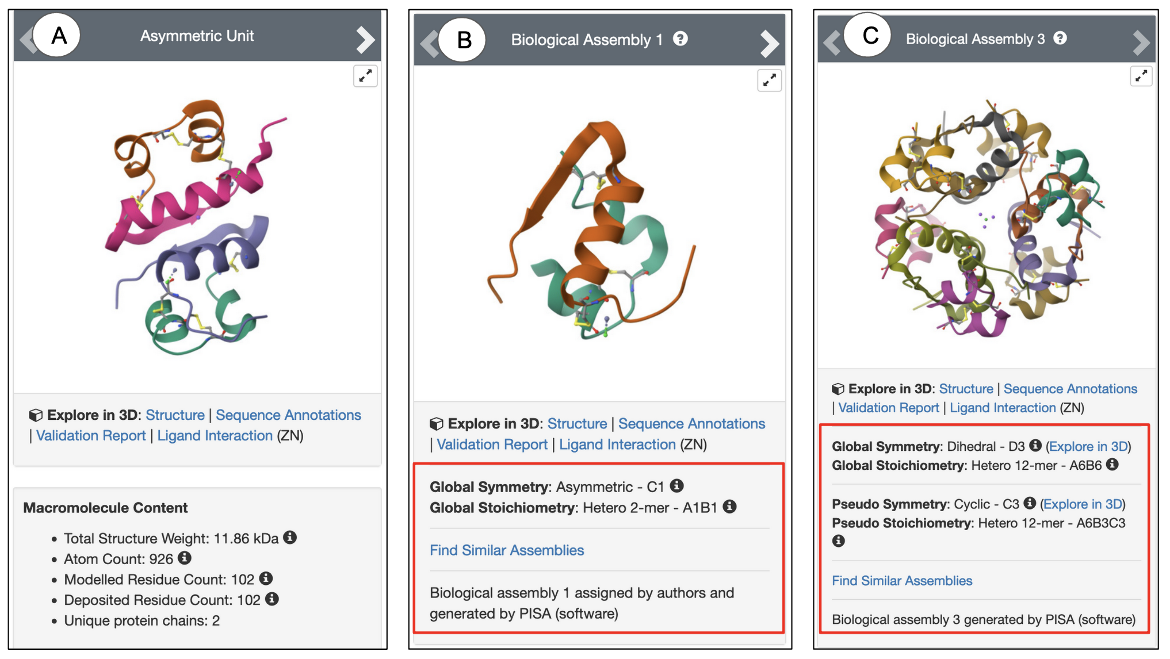
|
| Figure 5: Snapshots of PDB ID 1trz showing (A) Asymmetric Unit; (B) Biological Assembly 2; (C) Biological Assembly 3. The red boxed regions display the Symmetry information for the specific assembly. |
Exploring other structures
The hyperlink “Find Similar Assemblies” below the symmetry information for the biological assembly being viewed allows you to search the 3D structures (including experimental structures and CSMs) that have a similar biological assembly. Learn more about searches for similar assemblies.
Header
The Interface
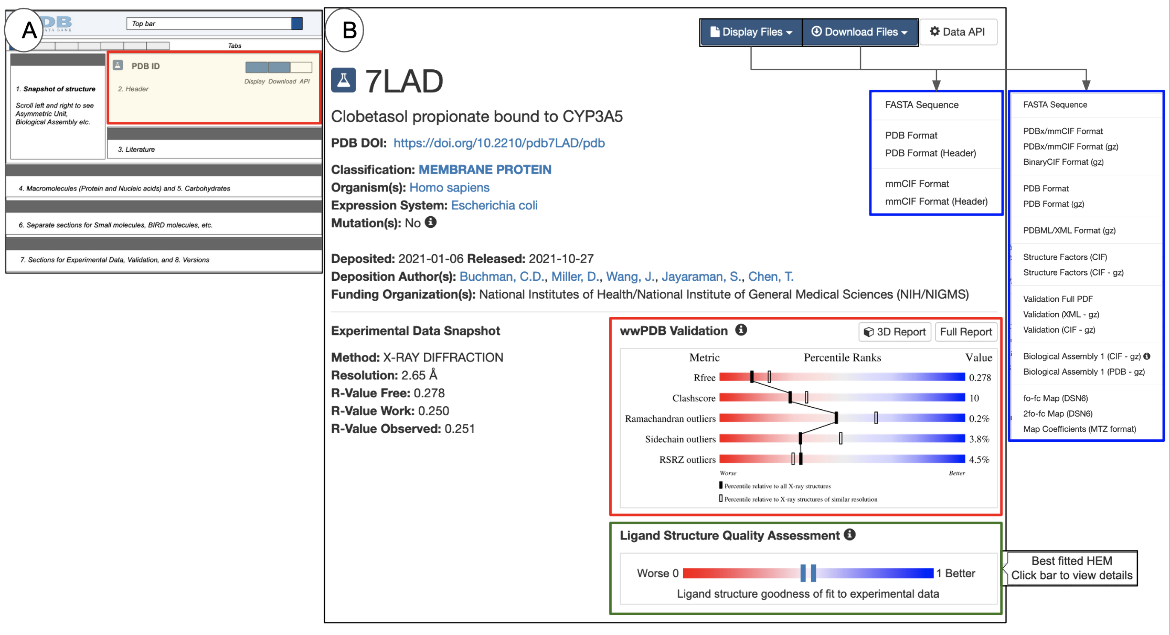
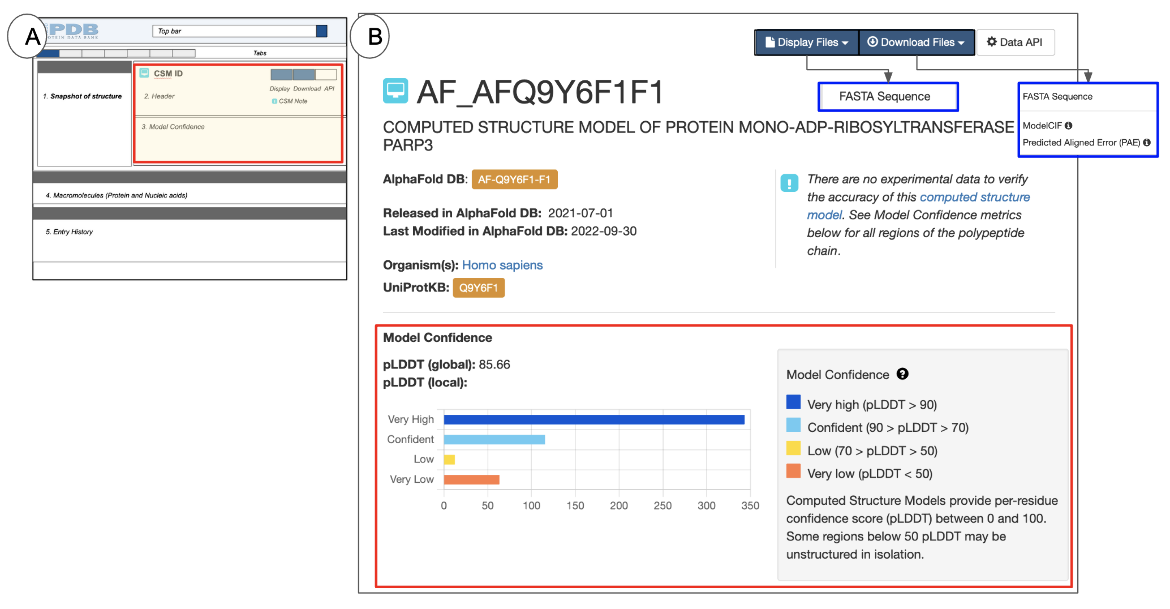
The Header is the section at the top of the Structure Summary page, just to the right of the structure’s image or snapshot (see Figure 6 and 7).
|
| Figure 6: The PDB entry Header: (A) a schematic of the Structure Summary page highlighting the Header in a red-outlined box; (B) examples of the Header for PDB ID 7lad (X-ray structure) |
The Header for an experimental structure includes the following:
- The PDB identifier, or PDB ID (e.g., 7lad in Figure 6B)
- A structure title that describes the contents of the structure and/or the purpose for the structure determination experiment.
- A digital object identifier (DOI) for the PDB entry. Each PDB entry is considered a publication and is assigned a DOI.
- The classification, which places the structure contents within one or more broad groups of molecule types, e.g., enzyme, hormone, immune complex, etc.
- A list of the source organisms of the macromolecule(s) in the structure. If a macromolecule was produced using genetic engineering methods, names of both the source organism and the expression host organism are included. Any specific mutations present in the macromolecule are also noted here.
- Deposition information for the structure: deposition date, release date, the list of authors who deposited the structure (this list may differ from the author list of the primary citation), and the funding source that supported the research.
- If the structure is a membrane protein, links to membrane protein data resources (e.g., OPM, PDBTM, MembProtMD, and mpstruc) that have information about the entry are also displayed here. See an example here. This information is also available from the Annotations tab. Learn more about membrane proteins.
|
| Figure 7: The CSM Header: (A) a schematic of the Structure Summary page highlighting the Header in a red-outlined box; (B) example of the Header for AF-Q9Y6F1-F1 (AlphaFold structure) |
The Header for a CSM includes the following information:
- The CSM identifier at the top of the page - this is an identifier assigned by RCSB.org
- A structure title that describes the contents of the structure and/or the purpose for the structure determination experiment.
- The source database from where the CSM was integrated - (e.g., AlphaFold in Figure 7B). Note the Source database assigned identifier is listed here in an orange box and hyperlinked to the original data source.
- A list of the source organism(s) for the macromolecule(s) in the structure.
- The identifiers and links to the protein sequence data source (e.g., UniProt) for all proteins in the entry
- Release date for the structure (in the source database)
- A note alerting users to review the Model Confidence metrics for the polymer(s) in the CSM
Learning about the Structure
The Header offers options to
- Display and Download the sequences of polymers present in the experimental structure and CSMs, and their coordinate files. The pull-down menus in the top right-hand corner of this section have options to display and download the files shown in the boxes outlined in blue (see Figures 6B and 7B). Learn more about file formats of experimental structures and CSMs.
- Data API button to launch the Data API query used to generate the page
- wwPDB Validation slider (outlined in red in Figure 6B) is included on all structure summary pages of experimental structures. It provides a quick assessment of the quality of the structure, where each row of the horizontal slider denotes a measure of structure quality. The vertical solid and hollow bars placed on the sliders represent the quality of the structure in percentiles. The location of the bar denotes the quality of a structure criterion, with blue/right indicating better and red/left indicating worse.
- In X-ray structures the solid bar represents the structure’s quality (in percentile) relative to all X-ray structures, while the hollow bar represents quality relative to other X-ray structures of the same or very similar resolution.
- For NMR and 3DEM structures the solid bar presents a percentile of the quality relative to all structures while the hollow bar represents quality relative to other structures solved by the same method. Learn more about wwPDB Validation reports.
- The full validation reports are available for download and for visualization in 3D (using Mol*) - see buttons for these options above the sliders.
- The Ligand Structure Quality Assessment slider (outlined in green) is displayed in the Header for X-ray structures that include small molecule ligands and have experimental data for validation data. The solid vertical bar represents the goodness of fit of the best instance of the ligand in the structure. The closer the bar is to the blue end of the slider, the better the goodness of fit to the experimental data. Clicking on this opens the Ligands tab, where you can learn more about the quality of the small molecule ligand. Learn more about Ligand Structure Quality.
- The Model Confidence section (outlined in red in Figure 7B) is included in all CSM structure summary pages. It lists a pLDDT (global) score, indicating the overall confidence for the model and a histogram showing the frequency of amino acid residues in various pLDDT (local) scores ranges. A key for the model confidence scores are also included. Learn more about CSMs and pLDDT scores.
Exploring other structures
Clicking on the hyperlinked words in the Classification, Organism names, and deposition Authors list will launch a search for experimental structures and CSMs available from RCSB.org that match the specific criterion. Learn more about Query by Example.
Literature
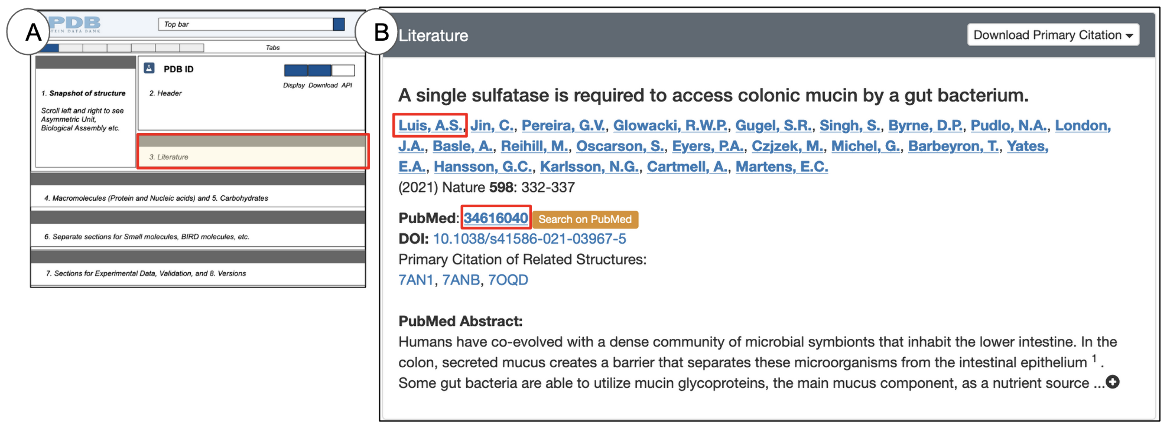
The Interface
The Literature section is located directly below the Header and presents information about the primary citation in which the structure is described or referenced (Figure 8). Depending on the publication status and availability of the primary citation abstract, you may also be able to read the abstract in this section. Currently there are no literature references available for individual CSMs.
|
| Figure 8: Literature section of PDB entries: (A) a schematic of the Structure Summary page with the location of the Literature section highlighted in red (B) Examples of the Literature section for PDB ID 7an1. |
Learning about the Structure
The Literature section provides access to description of the purpose(s) and process(es) of the experiments performed to determine the structure. You can learn the following from this section:
- Title of the primary citation that describes this structure
- The complete list of authors who wrote the primary citation. Note that this list may or may not be the same as the structure author list in the Header.
- The publication year, journal name, volume, and page numbers for the primary citation
- If a DOI is available for the primary citation, it is provided as a hyperlink so that it can be directly accessed.
- Alternatively, you can also look up the primary citations by clicking on the orange “Search in PubMed” button.
- If the abstract of the primary citation is available in PubMed, it is included under “PubMed Abstract” and is available for you to read and learn about the research that produced the structure(s). This provides the context and motivations for the experiments performed.
Exploring other structures
Although the Literature section presents primary citation information for the structure (if available), there are options to identify other structures in the PDB that share the same citation or are related in some other way.
- If there is more than one structure described in the primary citation, the PDB ID(s) of all structures in the citation are usually provided here. See an Example here.
- Clicking the hyperlinked name of an author will launch a search for other structures for which they are also listed as a citation author.
- The hyperlinked PubMed ID can be used to query the archive for other structures that also use this as their primary citation.
Note: A PDB structure that lacks a primary citation or whose primary citation has not yet been published may be presented as “To be Published”. These structures may not have any details in this section of the Structure Summary Page aside from the structure title and one or more authors. When the primary citation information becomes available it is added to the entry, and the version number is updated. Learn more about Versions here.
Some PDB structures may have additional citations. These secondary citations are not included in the Literature section of the Structure Summary Page (for clarity), but are present in the coordinate file. See an example here.
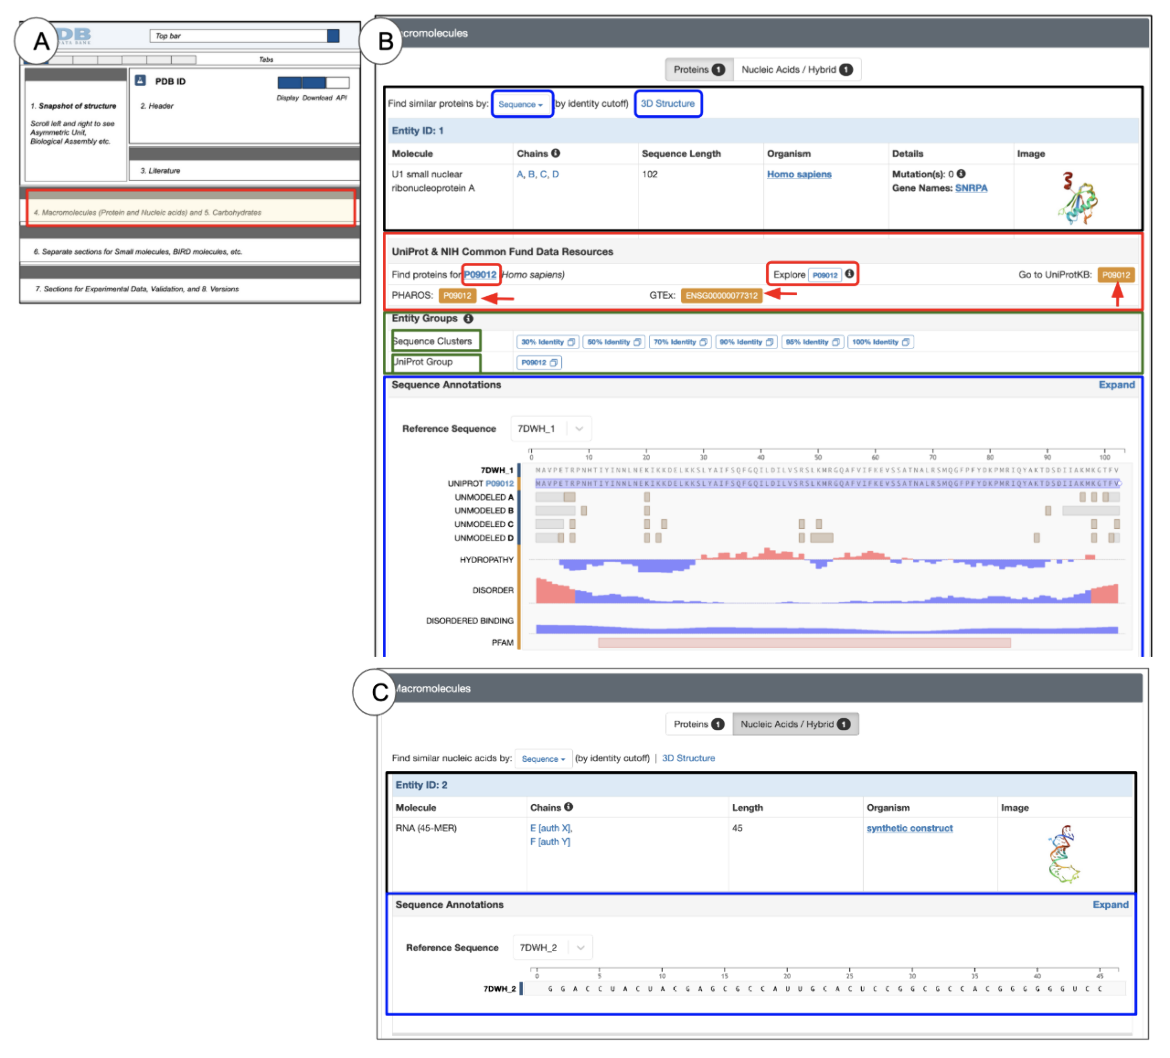
Macromolecules
The Interface
The Macromolecules section is located below the Literature section and presents information about macromolecules e.g., proteins and/or nucleic acid polymers, present in the structure. Each entity is listed here along with chain identifiers for each of its instances. Learn more about Chain IDs. A variety of information about the polymers, integrated from different bioinformatics data resources, is also presented here.
Structures that include both protein and nucleic acid polymers have the option to display either protein or nucleic acid entities on the page by selecting the appropriate tab in the top panel of this section (Figure 9).
|
| Figure 9: Macromolecule section of the Structure Summary Page: (A) a schematic of the Structure Summary page highlighting the location of the Macromolecules section in red (B) and (C) examples of the Macromolecule section from PDB ID 7dwh showing the Protein entity (B) and Nucleic Acid entity (C) in the structure. |
- The top lane below the section heading shows two tabs: Proteins and Nucleic Acids/Hybrid.
- Presence of this option indicates that the structure includes proteins and nucleic acid or hybrid polymers
- The tab selection determines which entity(ies) will be displayed on the page
- The number written in a tab indicates the number of entities of that type.
- Proteins tab: Information presented for protein structures can be divided into three blocks:
- PDB entry-based information
- UniProt mapped Resources
- Sequence Annotations
- Nucleic Acids/Hybrids tab: Information presented for nucleic acids can generally be divided into two blocks:
- PDB entry-based information
- Sequence Annotations
Learning about the Structure
Things that can be learned from examining the Macromolecules section of the Structure Summary page are included here.
PDB entry-based information (black box in Figure 9 B and C): Information for each polymer entity is listed in a tabular format with the entity ID listed on a light blue header row. Similar types of information are included for both protein and nucleic acid polymers.
- Molecule: The polymer name is specified here. For proteins, the UniProt name is commonly used as the protein name. Alternate names and/or synonyms may also be used. If only a part of the complete protein was used in the experiment the authors may specify that here (e.g., Insulin Receptor, Tyrosine Kinase domain (see PDB ID 1gag). For short peptides and nucleic acid polymers the name may list the sequence or list the number of amino acids or nucleotides present (see PDB ID 6d2u).
- Chains: A quick glimpse of this field tells you how many copies (instances) of the polymer are present in the deposited coordinates. The identifiers of all instances of the polymer chain are included here.
- Sequence Length: The length of the polymer chain is listed here - e.g., you can learn if this polymer is 30 or 300 amino acids long
- Organisms: The name of the source organism is listed here - e.g., you can learn here if this is a human, E. coli, spinach or yeast protein.
- Details: Any details about the polymer - e.g., mutations, gene name, are included here.
- Image: The snapshot of the polymer provides a quick glimpse of what the protein/complex looks like - e.g., globular, fibrous, mainly helical, with many disordered loops.
UniProt-mapped Resources (red box in Figure 9B): Information presented here is based on data mappings using the Structure Integration with Function, Taxonomy, and Sequence (SIFTS) project. Learn more about the SIFTS project. The link on the UniProt ID in the left launches a PDB archive-wide search for all instances of polymers with the given UniProt ID. The Explore UniProt ID button opens the Group Sequence tab for that specific UniProt ID showing a sequence alignment of all matching PDB instances of the whole or part of this protein polymer, to the UniProt sequence.
- Orange boxes with red arrows pointing towards them (shown in Figure 9) are links to external resources that integrate a variety of information about the specific entity being explored. For example:
- UniProtKB or UniProt Knowledge Base integrates amino acid sequence, protein name or description, taxonomic data, and functional and citation information along with information about biological ontologies, classifications, and cross-references to a variety of other data resources. Learn more about UniProtKB.
- PHAROS is a knowledge management user interface for the Druggable Genome (DG). It is mostly focused on three protein families that are common drug targets, specifically, G-protein-coupled receptors (GPCRs), Ion channels (ICs) and Kinases. It can be used to learn about the target and any uncharacterized or poorly annotated part of the druggable genome. Learn more about PHAROS.
- GTEx or the Genotype-Tissue Expression (GTEx) project is a resource to explore expression and regulation of human genes and their relationships to genetic variation. It can be used to learn about common diseases, e.g., heart disease, cancer, diabetes, asthma, and stroke, and to examine changes in the non-coding regions of related genes, their regulation, and expression levels. Learn more about GTex.
- IMPC or International Mouse Phenotyping Consortium attempts to identify the function of every protein-coding gene in the mouse genome. Where available, links to the resource are included in this section. The PDB ID 7dwh does not have any entity with IMPC links, but you can see an example here. Learn more about IMPC.
Entity Groups (green outlined box in Figure 9B): This section presents links to view group summary pages based on sequence clusters (at various levels of sequence identity) and by UniProt Accession. Learn more about group summary pages and sequence clustering here.
Sequence Annotations (blue outlined box in Figure 9 B and C): This section contains a graphical summary of information on the sequence of the polymer, integrated from a variety of sources. Clicking on the hyperlinked UniProt Id listed in this section also opens the group sequence tab.
- The annotations and features may be derived from the PDB entry (marked with a blue bar on the left of the graphical display) and a variety of external sources (marked with an orange bar on the left of the graphical display).
- Click on the Expand button on the top right corner of this section (see black arrow) to access the complete view, also available from the Sequence tab.
- Learn more about the Sequence Annotations, resources from which data is integrated and conventions used for the graphical display.
Exploring other structures
Hyperlinked words and phrases in the Macromolecules section allow you to launch searches for similar and/or related structures.
- In the PDB entry-based information: (i.e., in the black box in Figure 9 B and C)
- Clicking on the button labeled “Sequence” (circled in blue) opens a pull-down menu to launch a sequence search. Learn more about Sequence Search.
- Clicking on the hyperlinked word “Structure” (circled in blue) launches a structure search. Learn more about Structure Search.
- In the UniProt-mapped Resources (i.e., in the red box in Figure 9B) the following options are available:
- By clicking on the “Find proteins for UniProt ID” hyperlink (red circle on the left), you can search for all PDB entries in which at least one entity has all or part of the sequence of this UniProt identifier. For the PDB ID 7lad, clicking on this option for Entity 1 produces these results (including experimental structures and CSMs).
- The hyperlinked Explore UniProt ID button (marked with a red circle in the middle of the page) opens a graphical display of the sequences of all PDB entries that use this UniProt identifier for any instance of its polymer chains. For the PDB ID 7lad, clicking on this option for Entity 1 will produce the graphical display (Figure 10).
- You can use the display shown in Figure 10 to rapidly identify whether the PDB entry in which you are interested has all or part of the protein (e.g., a domain or a short peptide), You can also identify PDB instances of the protein with mutations or mismatches present at specific locations, and you can learn whether the polymer chain has unmodeled regions, etc.
- Besides experimental structure derived features, you can also see a summary of annotations from UniProt and other resources - e.g., genome variants and metal binding sites. These are marked with an orange line on the left side of the annotations.
- Learn more about the conventions used on the page that is produced when you explore PDB sequences matching all or parts of a given UniProt ID.
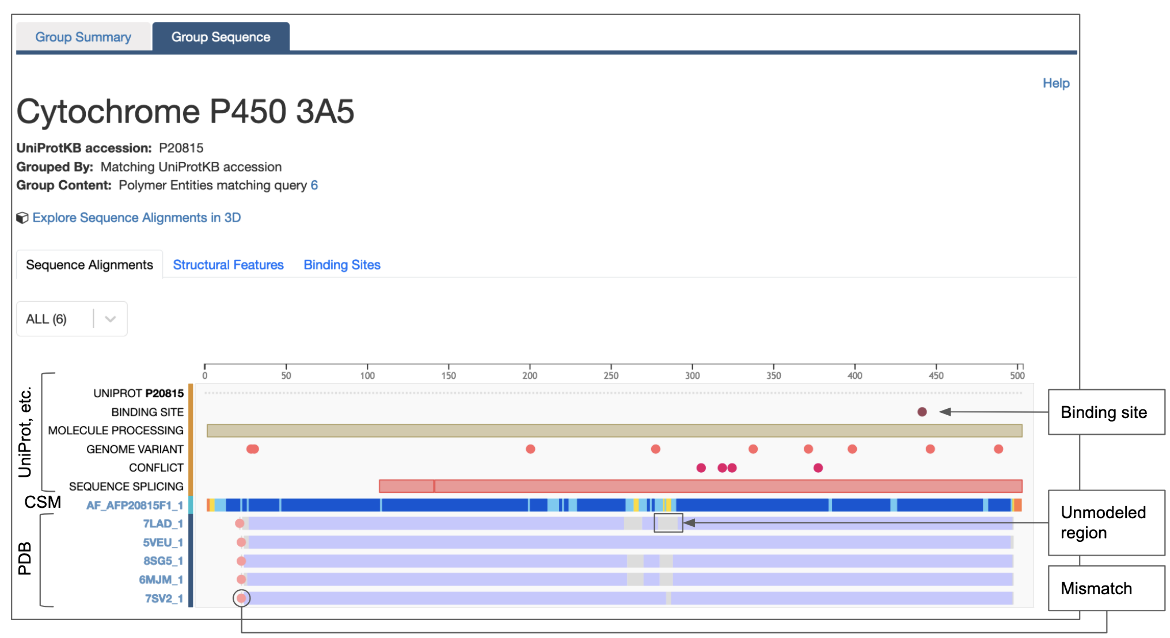
|
| Figure 10: Graphical display of all instances of a specific UniProt ID in the PDB displaying various annotations mapped from UniProt. |
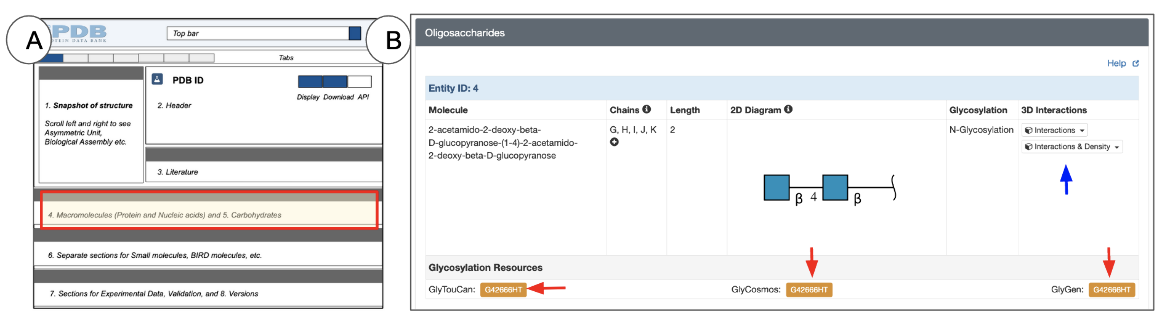
Oligosaccharides
Oligosaccharides are polymeric entities that can form both linear and branched chains. Unlike proteins and nucleic acids, representations of oligosaccharides need to include the type and order of the saccharides, or sugars, as well as information about the type of linkages connecting each of the saccharides. This is displayed using the Symbol Nomenclature for Glycans (SNFG).
The Interface
The Oligosaccharides section appears on Structure Summary pages for those PDB entries that include one or more sugar (saccharide) polymers (Figure 11). Entries without any oligosaccharides do not display this section on the Structure Summary page.
|
| Figure 11: Oligosaccharides section of the Structure Summary Page: (A) a schematic of the Structure Summary page highlighting the location of the Oligosaccharide section in red (B) an example of the Oligosaccharide section from PDB ID 6m17. |
Learning about the Structure
For each oligosaccharide entity, the Oligosaccharide section presents the following types of information about glycans presented in a tabular format for each entity:
- Molecule name: the common name for the oligosaccharide, if available. If no common name is available, under most circumstances a name is created at the time of entry annotation to specify the complete molecule, including the chemical names of its component sugars and the linkages connecting them.
- Chains: the number of copies (instances) of the oligosaccharide present in the deposited coordinates. The identifiers of all instances of the oligosaccharide are included here.
- Chain length: the number of saccharides (or sugars) present in the Oligomer. It may range from 2-30 or more.
- 2D diagram: Since oligosaccharide polymers may have branched structures a special 2D representation (SNFG) is used to display the saccharide components’ order and connections in the entity. Learn more about carbohydrates in the PDB and the SNFG representations.
- Glycosylation: the type of glycosylation (either N-linked or O-linked). Note: Not all glycans present in PDB structures are linked to proteins or other polymers - some are free-floating polysaccharides (e.g., parts of cellulose in 5td4).
- 3D interactions: The button (marked with a blue arrow in Figure 11) provides access to view the oligosaccharide entity in 3D. Clicking this button opens the PDB entry in Mol* and focuses on the first instance of the oligosaccharide, displaying its interactions with neighboring residues. Other instances of the oligomer can be viewed by selecting them from the pulldown menu options presented next to the button. Learn more about Mol* and how to use it in the 3D View tab or Mol* documentation.
Note: Oligosaccharide entities need to have at least two sugars covalently linked to each other. Single sugars, whether they are non-covalently interacting or covalently attached to a protein or nucleic acid, are not listed in the Oligosaccharides section. This means that instances where only one sugar of an oligosaccharide is modeled in the coordinate data are excluded from the Oligosaccharides list, with the single sugar being reported as a ligand.
In addition to the information directly available from the PDB structure, the Oligosaccharides section of the Structure Summary page also provides links to a few glycan resources that have annotations and links to other resources that have additional information about the glycan. Clicking on the orange buttons next to these resource names will take you to the external resource page that provides information about that oligosaccharide.
- GlyTouCan is an international glycan structure repository which assigns unique accession numbers for use by various glycan resources. Learn more about GlyTouCan.
- GlyCosmos integrates information about genes, proteins, lipids, pathways, and diseases related to or involving glycans. Learn more about GlyCosmos.
- GlyGen is a data resource that integrates and disseminates data pertaining to carbohydrates and glycoconjugates. This computational and informatics resource enables you to explore and search through glycan data in a manner that cannot be done in any one of the individual data resources. Learn more about GlyGen.
Explore the Oligosaccharides section in another PDB entry (4q6y) with slightly larger glycan molecules.
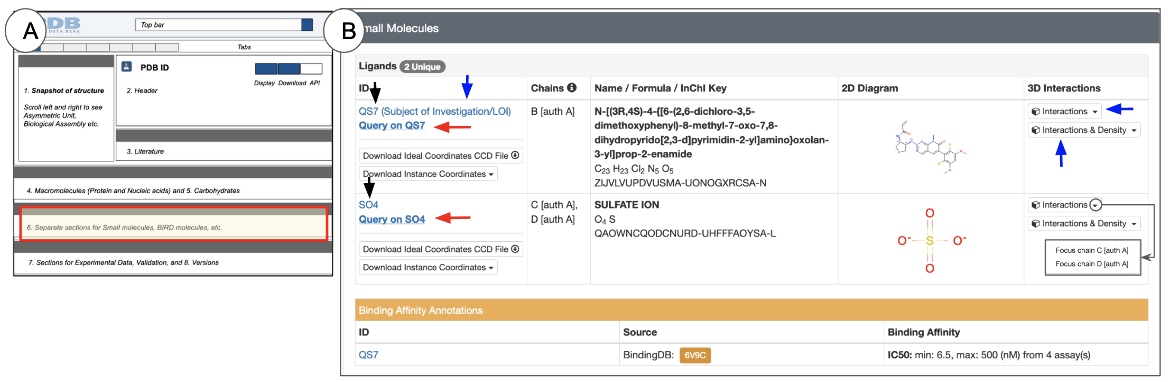
Small Molecules
Small molecules such as ions, ligands, cofactors, inhibitors, and drug molecules are often found in complexes with proteins and nucleic acids in experimental structures. Some of these small molecules play roles in stabilizing structures and balancing charges, while others are required for biological function. In experimental structures, one or more ligands in a structure may be designated as the “Subject of Investigation”. These ligands are likely to have been the focus of experiments performed for - or related to the determination of the structure.
Learning about where small molecules bind and how they interact with macromolecules can help us understand their functions in order to regulate them and design and engineer new properties and functions.
The Interface
The Small Molecules section is located below the Macromolecules section (Figure 12). Note that small molecules are non-polymeric entities, so their entity IDs are displayed on a grey header row instead of the light blue header row used for polymeric entities.
|
| Figure 12: Small molecules section of the Structure Summary Page: (A) a schematic of the Structure Summary page highlighting the location of the Small Molecules section in red (B) an example of the Small Molecules section from PDB ID 6v9c. |
The information about the small molecules in the structure is presented in two major subsections:
- Chemical and structural data - this subsection is marked with a grey header row labeled “Ligands”. The wwPDB Chemical Components Dictionary includes chemical and structural information about all small molecules in a PDB entry. Links to the dictionary are included in this subsection.
- Binding data - this subsection is marked with an orange header row (indicating that this information is derived from an external bioinformatics resource). It is only presented if binding data for one or more small molecules in the PDB entry are present in at least one of the Binding databases.
Learning about the Structure
The Ligands subsection lists the number of unique small molecules present in the structure. For each of these ligands you can learn the following:
- ID: This is the unique chemical component identifier for the ligand from the wwPDB Chemical Component Dictionary
- Clicking on the words “Subject of Investigation” (blue arrow in Figure 12) opens the ligand validation details in the Ligands tab
- Chains: This specifies the identifiers of the polymer chains with which the small molecule is associated. Note: in some cases where the PDB-assigned and author-defined chain IDs are different, both IDs are listed, e.g., “B [auth A]” in Figure 12. Learn more about Chain IDs.
- Name / Formula / InChI Key: Here are listed the chemical or common name for the ligand, its formula, and its InChI Key
- 2D Diagram: This chemical drawing provides a quick overview of the ligand structure
- 3D Interactions: This column presents buttons to view the ligand and its interactions in 3D.
- The button in this field (marked with a blue arrow in Figure 12) provides access to view the small molecule in 3D. Clicking this button opens the PDB entry in Mol* and focuses on the first instance of the small molecule while displaying its interactions with neighboring residues. Other instances of the small molecule can be viewed by selecting them from the options in the pull down menu, next to the button. Learn more about Mol* and how to use it in the 3D View tab or Mol* documentation.
- Another button to view the ligand's interactions along with the electron density map is also available in the 3D Interactions column, where available (i.e., when the experimental data is available). This is also marked with a blue arrow.
The binding data subsection lists information about the binding of a ligand to its target macromolecule (e.g., IC50, EC50, Kd, Ka, Ki). These data are integrated from external resources. Clicking on the orange buttons included in this subsection will open the entry-specific pages at the external resources. Learn more about BindingDB.
Exploring other structures
To identify other structures that include the ligand you wish to explore you can do the following:
- Click on the hyperlinked ID - e.g., QS7 or SO4 (black arrows in Figure 12), and open the corresponding ligand summary page with detailed information about the ligand and all its instances (either as free ligands or as part of a polymer).
- Click on the hyperlink “Query on the Ligand ID” (red arrows in Figure 12) to launch a search for all other entries in the PDB that include this ligand.
- The chemical formula and InChI Descriptors can be copied from the Ligand Summary page and used to run Chemical Searches to find similar ligands and the PDB entries that contain them. Learn more about Chemical Search.
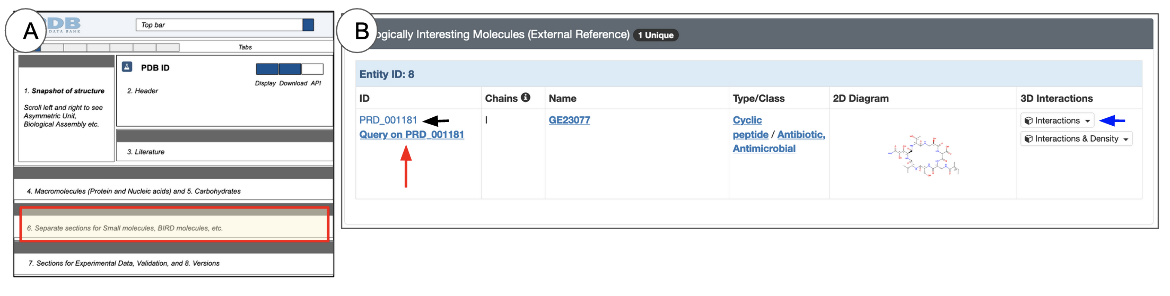
Biologically Interesting Molecules
Some inhibitors, drugs, and antibiotics are made up of a mixture of amino acids, saccharides, and nucleotides, but include non-standard residues and linkages connecting them. These Biologically Interesting Molecules are too big to be considered small molecules yet can not be classified as macromolecules or oligosaccharides, and so form a group of their own. The Biologically Interesting Molecule Reference Dictionary (BIRD) is maintained by wwPDB. Learn more about BIRD here.
The Interface
If a BIRD molecule is present in a 3D structure, the Biologically Interesting Molecules section is included either below or in place of the Small Molecules section on the Structure Summary page.
|
| Figure 13: Biologically Interesting Molecules section of the Structure Summary Page: (A) schematic of the Structure Summary page highlighting the location of the Biologically Interesting Molecules section in red; (B) an example of the Biologically Interesting Molecules section from PDB ID 4oiq. |
This section of the page shows chemical and structural data for BIRD molecules as a table (Figure 13). In some cases Binding data for BIRD molecules may also be available.
Learning about the Structure
Here are a few things you can learn about BIRD molecules form this table:
- A blue header row in the table (Figure 13) indicates that the molecule has a polymeric nature
- ID: the molecular ID that is assigned to it in BIRD.
- Chains: the Chain ID(s) associated with this molecule.
- Name: the Biologically Interesting Molecule’s common or chemical name
- Type/Class: information is derived from the BIRD that specifies the structural and/or functional role of the molecule
- 2D diagram: This chemical drawing provides a quick overview of the molecule’s structure
- 3D Interactions: The button in this field (marked with a blue arrow in Figure 13) provides access to view the Biologically Interesting Molecule in 3D. Clicking this button opens the PDB entry in Mol* and focuses on the Biologically Interesting molecule while displaying its interactions with neighboring residues. Learn more about Mol* and how to use it in the 3D View tab or Mol* documentation. Another button to view the ligand's interactions along with the electron density map is also available in the 3D Interactions column, where available (i.e., when the experimental data is available).
Exploring other structures
To identify other structures that include the Biologically Interesting Molecule, do the following:
- Click on the hyperlinked ID - e.g., PRD_001181 (black arrows in Figure 13), and open the corresponding BIRD summary page with detailed information about the molecule and all its instances
- Click on the hyperlink “Query on the BIRD ID” (red arrows in Figure 13) to launch a search for all other entries in the PDB that include this molecule.
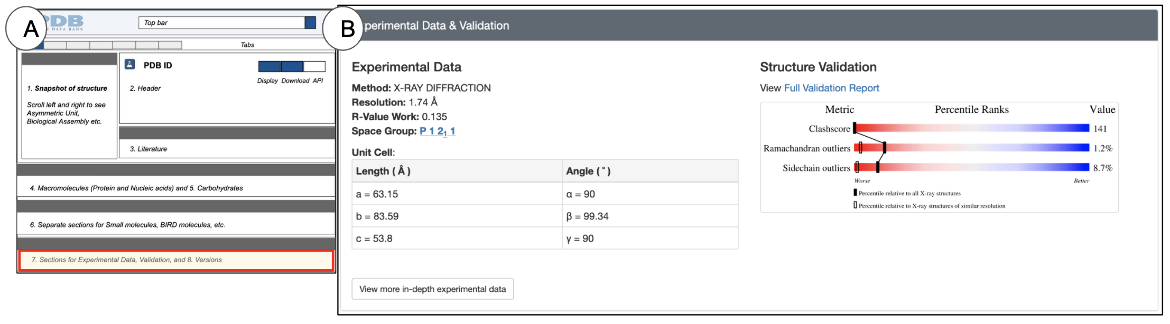
Experimental Data and Validation
The Interface
The Experimental Data and Validation section is located towards the bottom of the Structure Summary page and provides a quick glimpse of the quality of the structure and how the structure was determined (Figure 14).
|
| Figure 14: Experimental Data and Validation section of PDB entries: (A) a schematic of the Structure Summary page highlighting the location of the Experimental Data and Validation section in red; (B) an example of the Experimental Data and Validation section for PDB ID 4hhb. |
Learning about the Structure
The Experimental Data and Validation section provides a glimpse of the experimental methods used for structure determination. A more detailed description of the methods is available from the Experiments tab. The Structure validation sliders are placed next to the experimental data to provide the user the opportunity to check the structure quality and assess whether it is suitable for the analysis being performed. A more detailed description of the validation sliders is available in the Header.
Entry History (and Funding Information)
The PDB archive is periodically updated to meet current data standards. In addition, an individual entry may also be updated by its author to improve model quality or to fix a minor error. Similarly CSMs are also updated/revised to include knowledge from additional information for structure prediction. .
Thus it is important to clearly record an entry’s version history and to make it accessible to users.
The Interface
The Entry History & Funding Information section is located at the very end of the Structure Summary page and lists both an entry’s version history and funding information, where available (Figure 15).
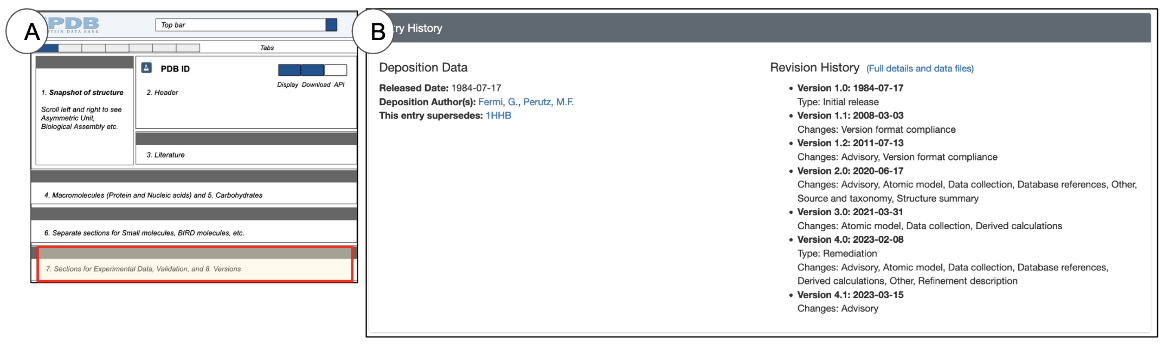
|
| Figure 15: Entry History & Funding Information section of PDB entries: (A) the schematic of the Structure Summary page for an experimental structure highlighting the location of the Entry History & Funding Information section in red; (B) an example of the Entry History & Funding Information section for PDB ID 4hhb. |
Learning about the Structure
The Entry History & Funding Information section provides a glimpse of an entry;s history, providing details of when it was updated and for what reasons those updates were made. A more complete history and options to download older versions of the entry are available from the Versions tab.


