


RCSB PDB Help
Grouping Structures
Grouping Search Results
Introduction
For many proteins, the PDB archive includes multiple structures, providing snapshots of the structure, interactions, and functions of these proteins under different conditions. This redundancy provides opportunities for exploration of biomolecular interactions and functions. In cases when the query results include many matches to the same or similar proteins, it may be helpful to be able to remove redundancy by grouping and organizing the search results in meaningful ways.
Why should you consider grouping Search Results?
While redundancy in the PDB enables a deeper understanding of biology, it may present some challenges in bioinformatics analysis. Here are four main reasons for grouping search results:
- Reducing the size of datasets (by examining distinct representatives of groups). This is particularly important as the size of the PDB continues to grow.
- Recognizing the relationship between various groups of the search results and exploring each group of results.
- Drawing attention to the full range of query matches - by hiding redundant matches from the results, less frequent but relevant results can become more prominent and included in exploration and analysis.
- Removing undesirable biases - which may be introduced if a result set has many similar and homologous proteins.
Documentation
Options for Grouping Search Results
Redundancy occurs at many levels - including at the level of sequence and/or structure similarity. A variety of different grouping methods can be applied to PDB data to provide a non-redundant view. Current options available allow grouping:
- Structures
- By PDB Deposit Group ID
- Polymer entities
- By Sequence similarity clusters
- By UniProt Accession
The choice of grouping options depends on the selected Return option, e.g., Structures, Polymer Entities. Different grouping options produce groups that can be used to explore different types of information. Once the query with selected grouping is run, the search results are organized into distinct groups and descriptive summaries of the groups are presented to the user. Search matches assigned to the same group are similar to one another based on the grouping criteria, e.g., sharing the level of sequence identity, while search results assigned to different groups should be different from one another.
Grouping Structures
Grouping by PDB Deposit Group ID
- Although PDB structures are each identified by a PDB ID, some PDB structures that are deposited by authors in batches have a common PDB Deposit Group ID.
- Criteria for membership in these groups is determined by the authors at the time of structure submission.
- Frequently these structures have the same protein(s), but with different ligands bound to them. For example, structures resulting from the screening for fragments binding to a specific target.
- Only a small number of structures in the archive have PDB Deposit Group IDs (e.g. G_#######). So organizing search results using this option will only include those structures which have this PDB Deposit Group ID (e.g., G_1002057). Structures in the results that do not have any Group Deposition ID are not listed in the grouped results.
Interface
If the Return is set to Structure and results are grouped using the Group Deposition ID option, the results will be organized by groups of structures that were deposited as a collection via RCSB PDB Group Deposition server. The results may be displayed as Groups or Representatives (see Figure 1).

|
| Figure 1: Grouping search results by PDB Deposit Group ID |
Grouping Polymer Entities
A polymer entity (e.g., a protein) may appear in the PDB archive in many different entries - by itself under different experimental conditions, with minor modifications (e.g., mutations or sequence variations), or in complex with other molecules, representing different functional states. While the structures of the protein in each entry may be different the sequence and its mapping to UniProt remain the same. Search results of a query for polymer entities can be organized in the following ways.
Grouping by sequence identity
- Polymer entities in the result list can be matched by using specific sequence identity criteria (from 100% to 30%).
- The sequence identity groups are based on sequence clustering done by RCSB PDB with weekly PDB archive release. Thus these groups are likely to change over time, as new structures are added to the archive. Learn more about sequence clusters here.
- Sequence clusters are based on alignments that involve nearly an entire sequence - i.e., sequence coverage must be at least 90%. So sequences of different lengths of the same protein may end up in different groups even if identity level is sufficient. For example, if different lengths of the same protein were included in the same or different structures, they may end up in different groups because of differing lengths.
Grouping by UniProt Accession
- Polymer chains in the result set are matched by the UniProt Accession associated with the polymer sequence.
- Grouping results by this method will classify all search results that have a specific UniProt ID, regardless of whether the structure includes the entire protein, parts of the protein, mutations, or modifications.
- Proteins included in a group defined by its UniProt ID may include polymer sequences and structures that match different domains of the complete protein and its variants.
Interface
When the Return option is set to Polymer Entities, the search results can be grouped using the UniProt Accession and various Sequence Identity options. Structures in the results that do not match both of the query and grouping criteria are not listed in the grouped results. The results may be displayed as Groups or Representatives (see Figure 2).
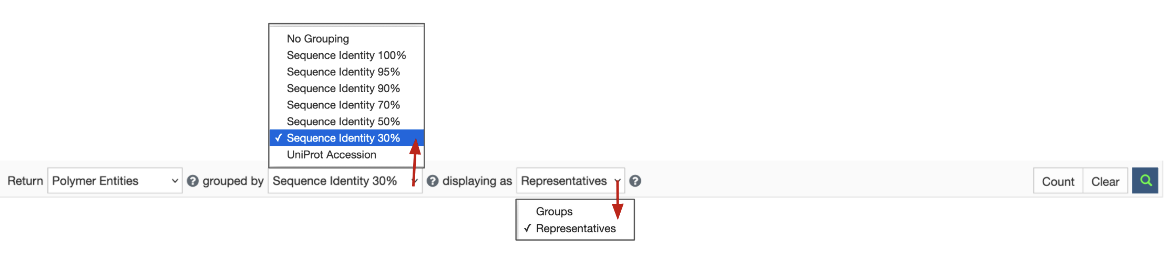
|
| Figure 2: Grouping search results by UniProt Accession and sequence identity |
Options for Displaying Grouped Results
The query is run with suitable grouping and display options so that the grouped search results may be viewed as:
- Groups - each of the groups shown in the grouped results page have a page summarizing properties of the group members that can be explored.
- Representatives - a list of representative members of each group. All other structures in the group are hidden. For the search and grouping criteria used, this is the set of non-redundant matches.
Grouped Search Results
Summary
Right below the Advanced Search Query Builder section of the webpage and quick search summary is presented, as shown in Figure 3. This indicates that the search yielded 8592 matches, of which 509 were organized into 27 groups, while 8083 matches could not be grouped because they did not match the grouping criteria (in this case it was the presence of PDB Deposit Group ID).
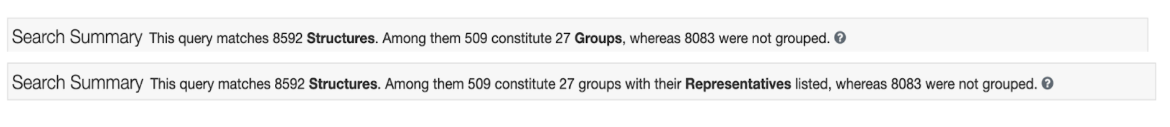
|
| Figure 3: Search Summary showing result groups displayed as groups or Representatives. |
The Groups view
This view displays a summary of each of the groups in the grouped search results.
- Each group in the list displays a few features relevant to the group (Figure 4).
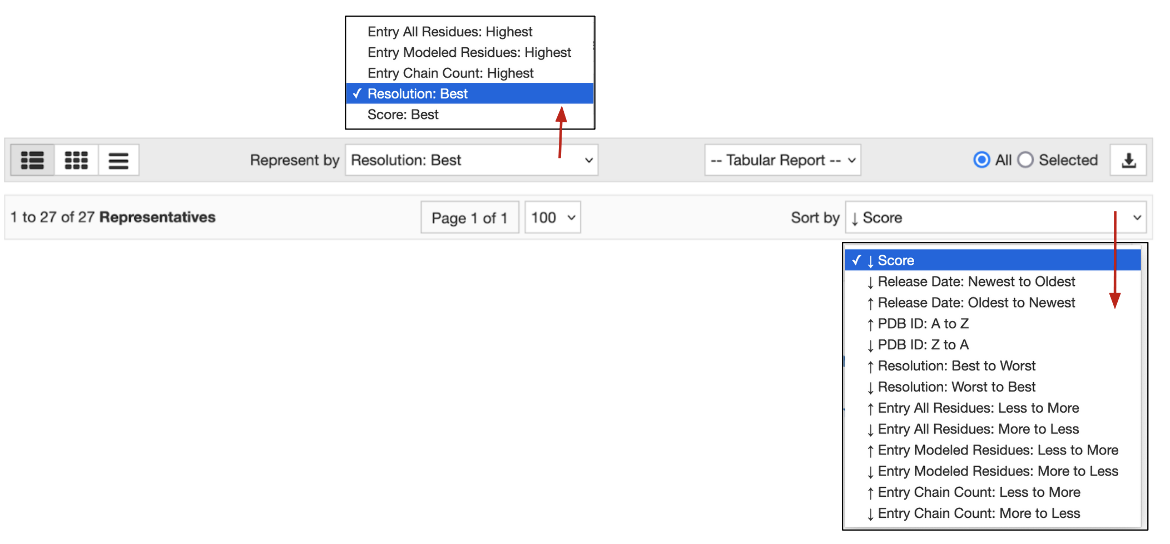
- The criteria for selecting the representative for this grouped result may be changed using the options available in the pulldown menu in the center of the page. These options include:
- Resolution: Best - the best or highest resolution structure (lowest number in the experimental structure resolution) for the refined structural model. Structures with no resolution have lower ranking compared to structures having assigned resolution values.
- Entry All Residues: Most - the largest total count of residues (e.g., amino acids) for all polymer entity instances reported per deposited structure model.
- Entry Modeled Residues: Most - the largest total count of residues (e.g., amino acids) with reported coordinate data for all polymer entity instances reported per deposited structure model.
- Entry Chain Count: Most - the largest total count of polymer entity instances per deposited structure model.
- Score: Best - the most relevant for a given search query.
- The order of groups displayed here may be sorted by a number of criteria available from the pull down list on the right of the page.
- Group Score: is calculated as the average of the relevance scores of the group members matching the search query
- Matched Count: is the number of group members matching the search query
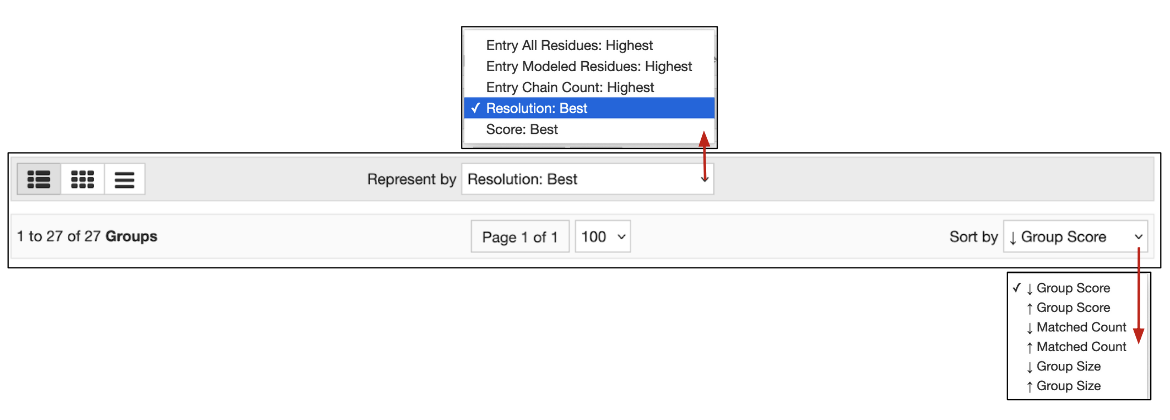
|
| Figure 4: Options for selecting representatives for the Groups view and options for sorting groups of search results |
Any one group listed on this page displays a few key pieces of information about the group member (see Figure 5).
- Group name (shown as red boxes in Figure 5) is assigned the name of the most frequent polymer name in the group.
- When grouping structures by sequence identity, the group names are inferred. The name for the most frequent protein is used as the group name. It is possible that this name doesn’t fully describe the group. This message “Accounts for % of matches“ and tooltip are in place to explain this. For example the name for the group shown in Figure 5 panel B is that of 98% of the members of that group.
- When grouping results by sequence clustering, the same proteins from different species may be grouped into different groups because of the level of their sequence identity. In this case, multiple groups of the search results may be assigned the same group name.
- Group ID is shown if the grouping criteria use either the PDB deposit Group ID (Panel A) or UniProt Accession (panel C). No group ID is shown for groups formed by sequence clusters because this identifier is subject to change over time.
- Group size is the number of entries in the group. The size is based on the archive content of the grouping option. For example, for grouping by UniProt Accession, the size of the group represents the total number of structures in the PDB archive that are mapped to that UniProt Accession. Note that any sequences that do not have UniProt assignment will not be a part of any groups based on UniProt Accession so may be left out of the grouping.
- Matched count refers to a subset of a whole group that matches your search query.
- The total size and matched count can be the same if your search returns all the members of a given group. Otherwise, matched count will be smaller, indicating that some members from a whole group were filtered out by search.
- Clicking on the hyperlinked matched count allows exploration of the matched group members.
- An image next to the group summary depicts the structure of the best example. The stack icon in the upper left corner of the image helps to visually indicate a group.
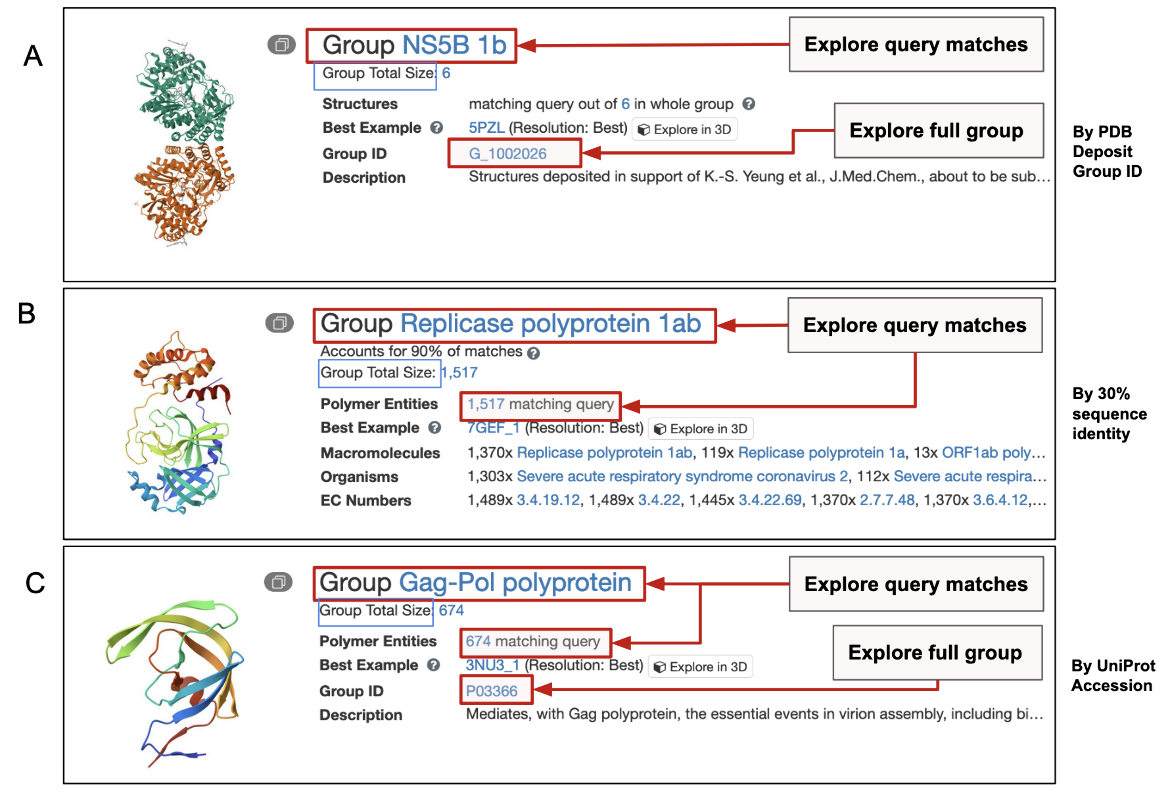
|
| Figure 5: Group views of a search result showing grouping by (A) PDB deposit Group ID; (B) sequence identity clusters; and (C) UniProt Accession. The Group name and contents link is shown in red outlined boxes, while the Group size is shown in a blue outlined box. |
Hyperlinks from the group display can open Group Summary pages to explore the sequences, structures, and other properties of group members.
The Representatives view
This view lists only representatives of the grouped search results.
- The number of structures listed here is usually smaller than that of the complete search results.
- The criteria for selecting the representative for this grouped result may be changed using the options available in the pulldown menu in the center of the page. These options include:
- Resolution: Best - the best or highest resolution structure (lowest number in the experimental structure resolution) for the refined structural model.
- Structures with no resolution have lower ranking compared to structures having assigned resolution values.
- Entry All Residues: Most - the largest total count of residues (e.g., amino acids) for all polymer entity instances reported per deposited structure model.
- Entry Modeled Residues: Most - the largest total count of residues (e.g., amino acids) with reported coordinate data for all polymer entity instances reported per deposited structure model.
- Entry Chain Count: Most - the largest total count of polymer entity instances per deposited structure model.
- Score: Best - the most relevant for a given search query.
- The entire list of representatives may be sorted by a number of criteria available from the pull down list on the right of the page. These include the same options available for sorting the full search results (see here).
|
| Figure 6: Options for selecting representatives for the Representatives view and options for sorting groups of search results |
Example
Exploring all protein targets of the drug, Imatinib:
The small molecule drug Imatinib or Gleevec (chemical component ID STI) is used for treating various types of cancer including chronic myeloid leukemia, acute lymphoblastic leukemia, aggressive systemic mastocytosis, and metastatic malignant gastrointestinal stromal tumors. Explore structures of STI-protein complexes in the PDB archive to explore its interactions with various target proteins.
- Find all PDB structures that include STI as a standalone ligand.
- Select Return type “Polymer Entities”, grouped by “Sequence Identity 95%” OR “Sequence Identity 30%” OR “UniProt Accession”, and displaying as “Groups” (Figure 7).

|
| Figure 7: Options for grouping search results of the example query |
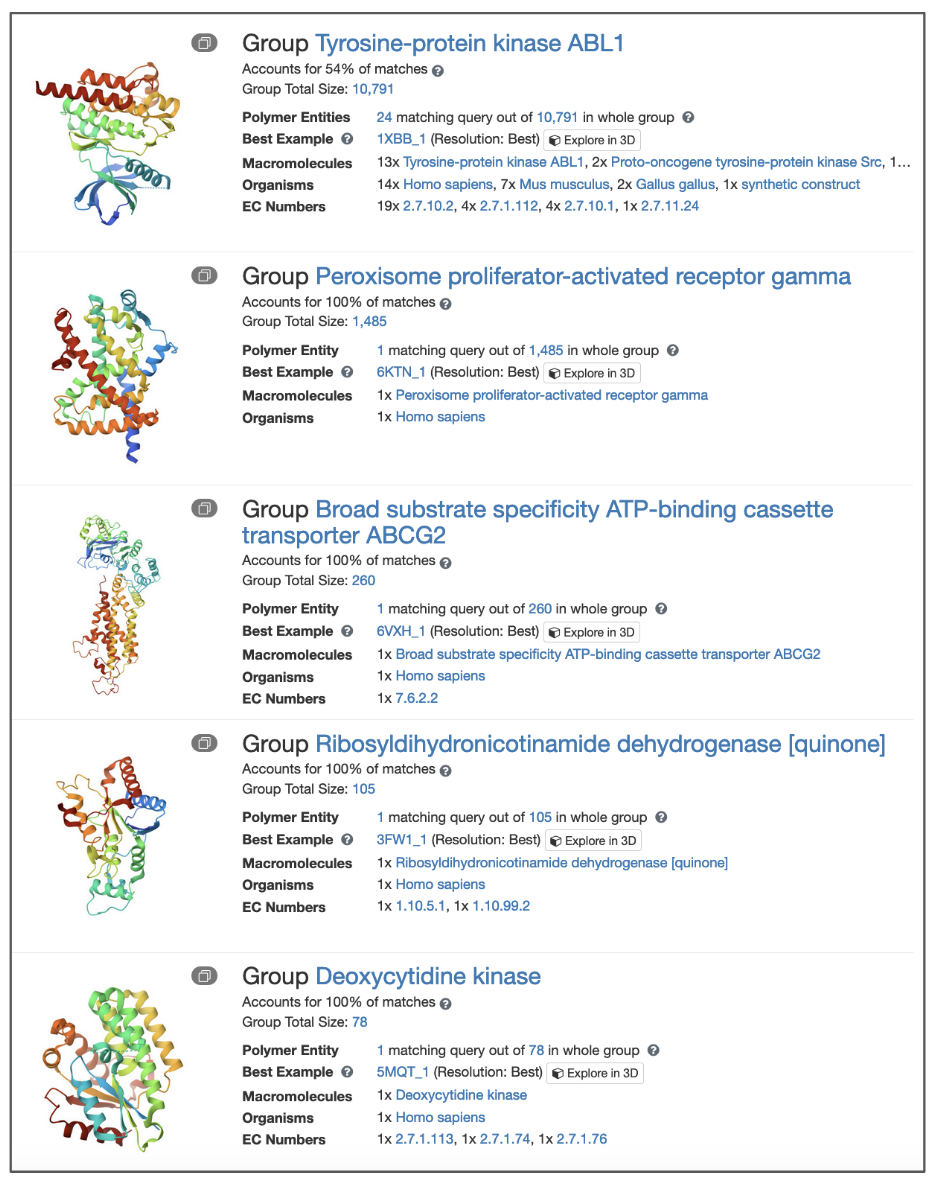
- Sort the list of groups by the highest number of matches and you will see that this drug binds to a variety of different kinases (see Figure 8). The Group Summary Pages for each of these groups may be opened to explore them further.
|
| Figure 8: Groups of different protein targets including various kinases that bind to the drug Imatinib. |


