


RCSB PDB Help
General Help
Ligand Structure Quality in PDB Structures
Introduction
The complete description of the PDB ligand structure quality metrics can be found in "Simplified quality assessment for small-molecule ligands in the Protein Data Bank" Structure 30(2):252-262.e4. doi: 10.1016/j.str.2021.10.003 (Shao et al., 2022).
What are ligands in the PDB archive?
Small molecules such as ions, solvent molecules, cofactors, etc. associated with biological polymers (e.g., proteins and nucleic acids) in PDB structures are referred to as ligands. Over 70% of PDB structures contain one or more small-molecule ligands, excluding water molecules, in macromolecular complexes. Small-molecule ligands in the PDB can be roughly classified as “functional” (i.e., ligands likely playing biological/biochemical roles) or “non-functional”. Functional ligands include co-factors, activators, inhibitors, substrates, products and intermediates, as well as analogs of any of these, while non-functional ligands are usually solvents, salts, ions, and crystallization agents. Structures of ligands bound to their protein or nucleic acid targets have proven useful for understanding their modes of interaction, binding strength, and selectivity (Burley 2021). The wwPDB Chemical Component dictionary (CCD) defines each unique small-molecule ligand found in the PDB with a distinct identifier CCD ID and a detailed chemical description (Westbrook et al., 2015). Each uniquely defined CCD ligand may be present in multiple PDB structures and may have multiple copies within one PDB structure.
What is ligand structure quality?
The quality of a ligand structure in the PDB can be assessed based on how well it matches with the experimental data and on the accuracy of geometrical parameters such as bond lengths and angles. The wwPDB validation report provides validation of individual ligand quality (Feng et al., 2021), including the local electron density goodness-of-fit indicators of real space R factor (RSR) (Jones et al., 1991) and real space correlation coefficient (RSCC) (Brändén and Jones 1990) for X-ray structures as calculated by EDS (Kleywegt et al., 2004); the chemical and geometrical structure quality indicator Root-Mean-Squared deviation Z-score for both bond lengths (RMSZ-bond-length) and bond angles (RMSZ-bond-angle) as calculated by Mogul (Bruno et al., 2004) based on small-molecule reference structures from the Cambridge Structural Database (CSD) (Groom et al., 2016); and a measure of inappropriate interatomic clashes calculated by MolProbity (Chen et al., 2010).
Currently, ligand quality analysis focuses on ligands in X-ray co-crystal structures with complete validation data of RSR, RSCC, RMSZ-bond-length, and RMSZ-bond-angle from the wwPDB validation reports. Please note that the following categories of ligands are NOT currently subject to ligand quality analysis: (a) Structures that were not solved by X-ray diffraction method (b) ligands without geometry features such as ion ligands with a single non-hydrogen atom (e.g., calcium or sodium ions), which lack the validation data on bond length and angle, and (c) ligands in X-ray structures lacking associated structure factor data (typically deposited prior to 2008), as goodness-of-fit to the experimental data cannot be calculated without structure factor data. (d) oligosaccharides that are represented as branched entities are currently not included in the quality report. Validation analysis on all oligomeric small molecules will be implemented in the future.
Why is it important to learn about PDB ligand structure quality?
Continuous growth of X-ray co-crystal structures in the PDB over the past fifty years has provided an enormous body of open access data for biomedical research. It has also created considerable challenges for PDB data consumers in deciding which PDB structure to use and for what purpose. Each instance of a ligand in the PDB archive may vary in its agreement with experimental data and chemical/geometric parameters. The ligand structure quality analysis allows PDB users to quickly select specific ligand instances of suitable quality for analysis, experiments, or molecular design.
Documentation
How is PDB ligand structure quality assessed?
To make it easy for PDB users to rapidly assess ligand structure quality, the RCSB PDB constructed composite ranking scores and implemented the scoring algorithm in an easy-to-interpret 2D ligand quality plot for a visual summary. The ligand quality composite ranking scores (1) aggregate correlated quality indicators into a unidimensional indicator, and (2) establish uniformly distributed composite ranking scores that simplify interpretation.
Aggregating correlated quality indicators into composite indicators - In statistics, reduction of two or more correlated variables to one variable can be done using Principal Component Analysis (PCA). For multiple variables, PCA finds a set of orthogonal vectors to represent the distribution of data in the multi-dimensional space. Each of these vectors is the linear combination of the multiple variables and is called the Principal Component (PC). The first Principal Component (PC1) may be used as a representative variable if it explains most of the variance of all variables. PCA was performed on RSR and RSCC (both are indicators on how well the ligand model fits the electron density). Their first Principal Component, designated as PC1-fitting, explains 84% of the variance of both RSR and RSCC, and is used as the one-dimensional (1D) measure of how well the ligand structure fits the local electron density. Another PCA was performed on RMSZ-bond-length and RMSZ-bond-angle (both are indicators of the geometry of the molecule) to yield PC1-geometry that explains 82% of the total variance. Thus PC1-geometry is used as the 1D composite indicator to assess accuracy of the chemical and geometrical parameters. Since the two PC1s described here are relatively independent of each other, the ligand fitting quality and geometry quality must be separately assessed by PC1-fitting and PC1-geometry, respectively. To learn more about this analysis see (Shao et al., 2022).
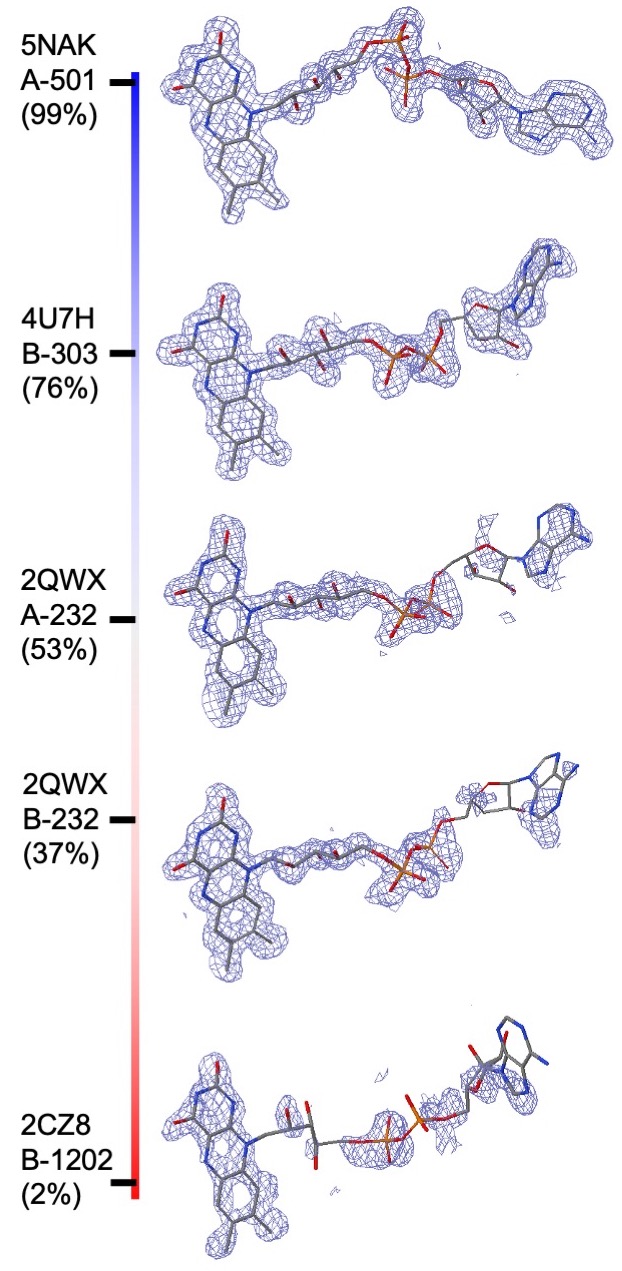
RCSB PDB ligand quality composite ranking scores: Composite indicators of PC1-fitting and PC1-geometry are calculated for all ligands in the PDB so that ligand structure quality can be ranked in the entire archive. Composite ranking score for a particular ligand structure is defined as the percentage of PDB ligands with inferior fitting or geometry quality to the ligand being queried, which is consistent with the ranking defined for overall model quality in the wwPDB validation report (Feng et al., 2021). Since ranking is uniformly distributed, composite ranking scores carry the simplest interpretation: 0% for the worst, 100% for the best, and 50% for median quality. For example, for the compound Flavin Adenine Dinucleotide (FAD) in different PDB entries composite ranking scores of PC-fitting are shown in the figure.
|
| Composite ranking scores for electron density fitting. All ligand instances are CCD ID FAD structures determined at 1.5 Å resolution, from best (top) to worst (bottom) along a colored vertical bar (blue: superior; red: inferior). PC1-fitting composite ranking scores are provided in parentheses below PDB ID, Chain ID, and residue number. N.B.: Two instances from PDB ID 2QWX were selected: residue #232 of chain A (2nd from the top) and residue #232 of chain B (3rd from the top). |
How to view and interpret ligand structure quality assessments?
For each ligand in the PDB that has been subjected to ligand structure quality analysis, RCSB PDB provides the following assessments:
- 1D slider for the ligand structure goodness of fit to experimental data - On the structure summary page, under the overall quality sliders, a single slider bar is added to show the goodness of fit of “Ligands of Interest” (LOI) present in the structure. LOI is a functional ligand in macromolecular complexes designated as focus of research in the experiment by structure authors or by RCSB PDB under the criteria of: (1) Formula Weight > 150 Da, and (2) Not in an exclusion list of likely non-functional ligands (Shao et al., 2022). The red end of the slider, labeled 0 (0%), shows a poor fit, while the blue end, labeled 1 (100%), shows a good fit. The best fitted instance for each type of ligand in the structure is shown with a solid vertical blue bar. Hovering the cursor over each of these bars will show the name of the ligand it corresponds to. Clicking on a vertical bar on the slider will open the “Ligands” tab to show further details about the ligand’s quality assessments.
- 2D ligand quality plots of the PC1-fitting and PC-1 geometry - In the new “Ligands” tab for the PDB entry, the experimental data fitting and geometry assessments for all instances of the ligand in the structure are shown in the first (left-most) 2D plot. The X-axis displays the composite ranking score for PC1-fitting, on how well the atomic coordinates describing the ligand structure are supported by experimental data; and the Y-axis displays composite ranking score for PC1-geometry, on how well the ligand structure conforms to known chemistry. A green diamond symbol represents the best fitted instance of this ligand in the entry, while all other instances are shown in green circles. The presentation is interactive. Hovering over the diamond symbol provides the ligand instance information and highlights additional details about it in a table on the page. Hovering over circle symbols will just highlight details about the ligand in the table on the page. Clicking on the diamond symbol (best instance of the ligand) will open a 3D view of the ligand in Mol* (Sehnal et al., 2021) and display the ligand along with the experimentally determined electron density map.
- 3D display of ligands and experimental data fitting - In the “3D View” tab, visualization of the ligand and local electron density based on experimental data in Mol* allows the PDB user to examine the ligand structure and how it fits the electron density. Users can quickly invoke the 3D ligand display with an electron density map from 2D ligand quality plot.
- Ligand structure quality comparison across PDB entries - In the “Ligands” tab for the specific PDB entry, ranking information is presented in more 2D graphs and in a tabular summary to help users compare ligand structures and select the best ligand model structures of the compound of interest from different entries. Two comparisons are made between the best ligand model of the current entry and (1) the best fitted ligand models of the same compound in other PDB entries with the same protein target; (2) the best fitted ligand models of the same compound in any other PDB entry. Other important quality metrics, including clashes and chirality errors, are also provided in the tabular report included on this page.
Example
The RCSB PDB ligand structure quality assessment provides various ways of viewing and selecting the best instance of a ligand for further analysis and as the starting point for design and development. The structure quality assessments of ligands with CCD ID Y01 and OIN in the PDB entry 6wjc are shown below:
On the Structure Summary Page: 1D slider
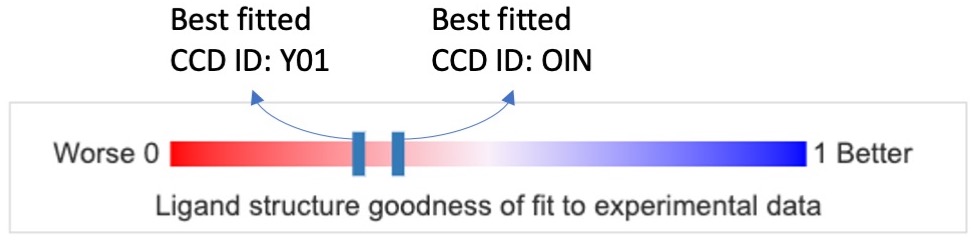
The figure below shows the ligand fitting quality presentation of the best instances of ligands with CCD ID Y01 and OIN. The red end of the slider, labeled 0 (0%), shows a poor fit, while the blue end, labeled 1 (100%), shows a good fit.
|
| Ligand quality summary slider on the Structure Summary Page. The 1D graph depicted in here has color coded ranking scales from worst (0%, red) to best (100%, blue) for PC1-fitting. The two dark blue bars represent the best fitted ligand model of Y01 and OIN, respectively, in PDB ID 6WJC. Clicking on any of the bars brings users to the following 2D ligand quality plot. |
On the Ligands tab page: 2D ligand quality plots and tabular report
You can reach the quality analysis for ligand Y01 in the Ligands tab by clicking on the bar for the best instance of the ligand Y01, or directly clicking on the Ligands tab and then choosing the Y01 ligand sub-tab.
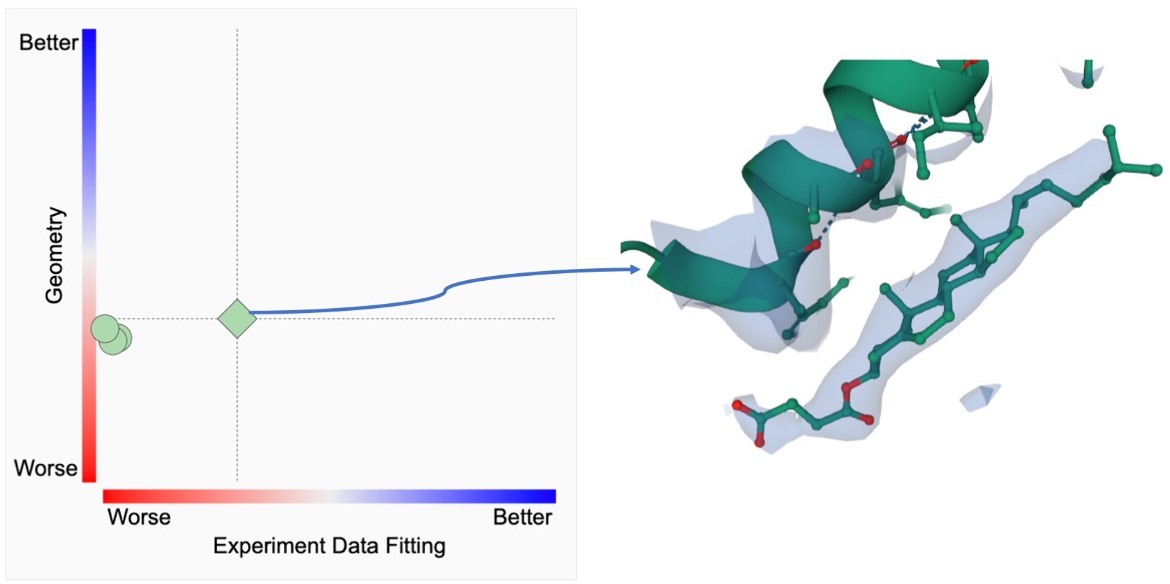
The ligand structure quality metrics and the actual ligand structure along with the experimental data (electron density) can be examined as shown below.
|
| RCSB PDB ligand quality plot. The 2D graph depicted has color-coded ranking scales from worst (0%, red) to best (100%, blue) for PC1-fitting (horizontal axis) and PC1-geometry (vertical axis). Each symbol represents a ligand instance of CCD ID Y01 in PDB ID 6WJC with its horizontal location marked by PC1-fitting and its height by that of PC1-geometry. The diamond symbol indicates the best fitted instance and clicking on it brings up a 3D display of electron density focused on the ligand structure. |
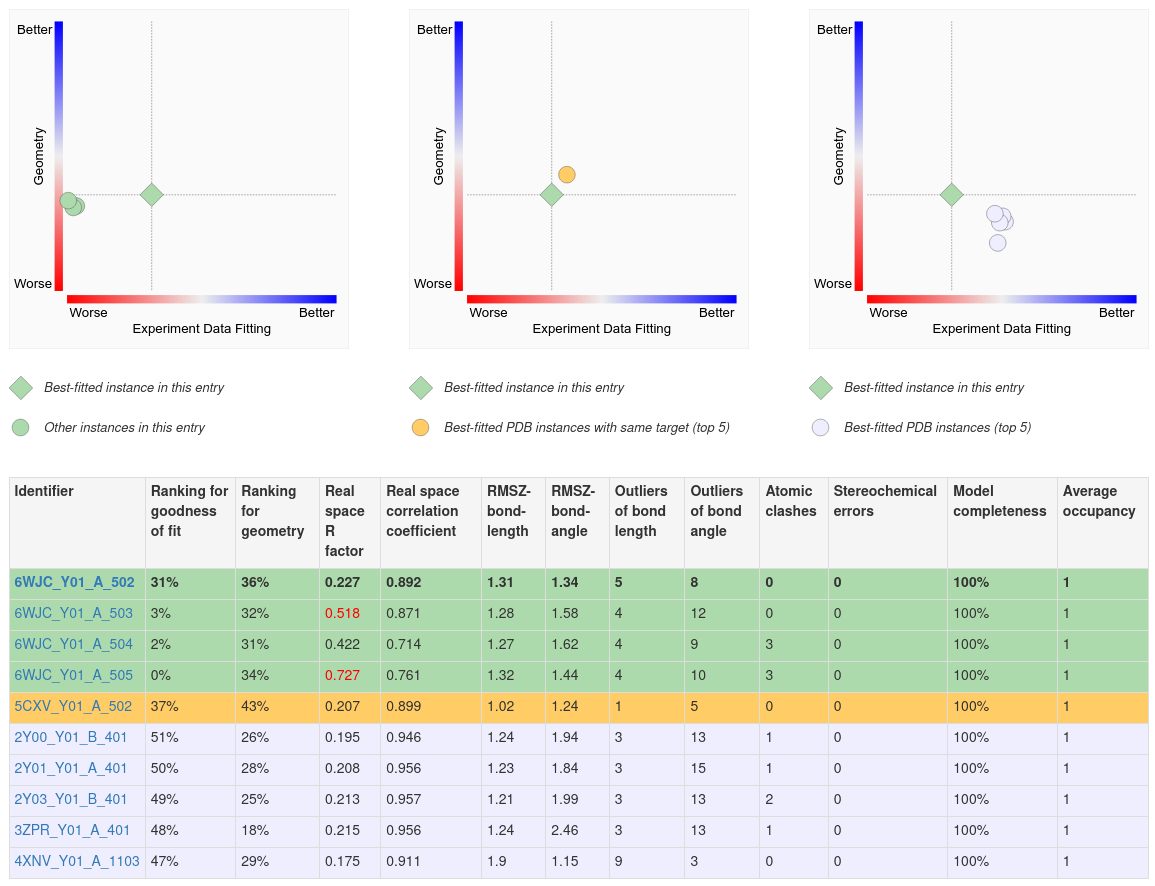
Several 2D plots and a tabular report display the quality of the ligand structure in a given PDB entry and compare it to other instances on the same page.
A. The first (left) plot on this page shows the 2D ligand quality plot for all Y01 instances in the structure. Clicking on the green diamond symbol (for the ligand Y01_A_502) opens the 3D view of this ligand in Mol*.
B. The second (middle) plot compares the best instance of the ligand in the structure to the top five best fitted instances of the ligand in other structures where that ligand is bound to the same polymer (e.g., protein or nucleic acid).
C. The third (right) plot compares the best fitted ligand instance to the top five best fitted instances of the ligand in complex with any polymer.
D. Complete details of the ligand structure quality assessments are shown in the table below the plots. This summary can be useful in identifying PDB entries and instances of the ligand that best meet analysis needs.
|
| Ligand structure quality comparison. The three 2D plots at the top display quality measures of the ligand structures of CCD ID Y01 within the same structure, comparison of the ligand structures of the same compound binding to the same protein target, and the structures of the same compound from any PDB entry, respectively. Only the top five PDB entries that contain the ligand are selected for the middle and rightmost plots. The green diamond symbol in each plot indicates the best fitted instance in the current PDB ID 6WJC, corresponding to the top row of the tabular report at the bottom. Other rows in the tabular report highlighted in green, yellow, and gray correspond to the ligand quality metrics shown as the same-colored circle symbols in the 2D plots above. Mousing over any symbols in the 2D plots highlights the corresponding row in the tabular report. In the table, the worst 1% outliers of each ligand quality indicators are highlighted in red font, and the identifiers in the first column are blue-font hyperlinks that lead to Mol* 3D electron density view focused on the ligands marked by the identifiers. |
References
- Brändén C, Jones T. (1990). Between objectivity and subjectivity. Nature. 343:687-689.
- Bruno IJ, Cole JC, Kessler M, Luo J, Motherwell WD, Purkis LH, Smith BR, Taylor R, Cooper RI, Harris SE et al., (2004). Retrieval of crystallographically-derived molecular geometry information. J Chem Inf Comput Sci. 44(6):2133-2144. doi:10.1021/ci049780b
- Burley SK. (2021). Impact of structural biologists and the protein data bank on small-molecule drug discovery and development. J Biol Chem.100559. doi:10.1016/j.jbc.2021.100559
- Chen VB, Arendall WB, 3rd, Headd JJ, Keedy DA, Immormino RM, Kapral GJ, Murray LW, Richardson JS, Richardson DC. (2010). Molprobity: All-atom structure validation for macromolecular crystallography. Acta Crystallographica Series D. 66(Pt 1):12-21. doi:10.1107/S0907444909042073
- Feng Z, Westbrook JD, Sala R, Smart OS, Bricogne G, Matsubara M, Yamada I, Tsuchiya S, Aoki-Kinoshita KF, Hoch JC et al., (2021). Enhanced validation of small-molecule ligands and carbohydrates in the protein databank. Structure. 29:393-400.e391. doi:10.1016/j.str.2021.02.004
- Groom CR, Bruno IJ, Lightfoot MP, Ward SC. (2016). The cambridge structural database. Acta Crystallogr B. 72(Pt 2):171-179. doi:10.1107/S2052520616003954
- Jones TA, Zou J-Y, Cowan SW, Kjeldgaard M. (1991). Improved methods for building protein models in electron density maps and the location of errors in these models. Acta Crystallogr A. 47:110-119.
- Kleywegt GJ, Harris MR, Zou JY, Taylor TC, Wahlby A, Jones TA. (2004). The uppsala electron-density server. Acta Crystallographica Series D. 60(Pt 12 Pt 1):2240-2249. doi:10.1107/S0907444904013253
- Sehnal D, Bittrich S, Deshpande M, Svobodova R, Berka K, Bazgier V, Velankar S, Burley SK, Koca J, Rose AS. (2021). Mol* viewer: Modern web app for 3d visualization and analysis of large biomolecular structures. Nucleic Acids Res. doi:10.1093/nar/gkab314
- Shao C, Westbrook JD, Lu C, Bhikadiya C, Peisach E,Young JY, Duarte J, Lowe R, Wang S, Rose Y, Feng Z, Burley SK. (2022). Simplified quality assessment for small-molecule ligands in the Protein Data Bank. Structure 30(2):252-262.e4. doi: 10.1016/j.str.2021.10.003
- Westbrook JD, Shao C, Feng Z, Zhuravleva M, Velankar S, Young J. (2015). The chemical component dictionary: Complete descriptions of constituent molecules in experimentally determined 3d macromolecules in the protein data bank. Bioinformatics. 31(8):1274-1278. doi:10.1093/bioinformatics/btu789


